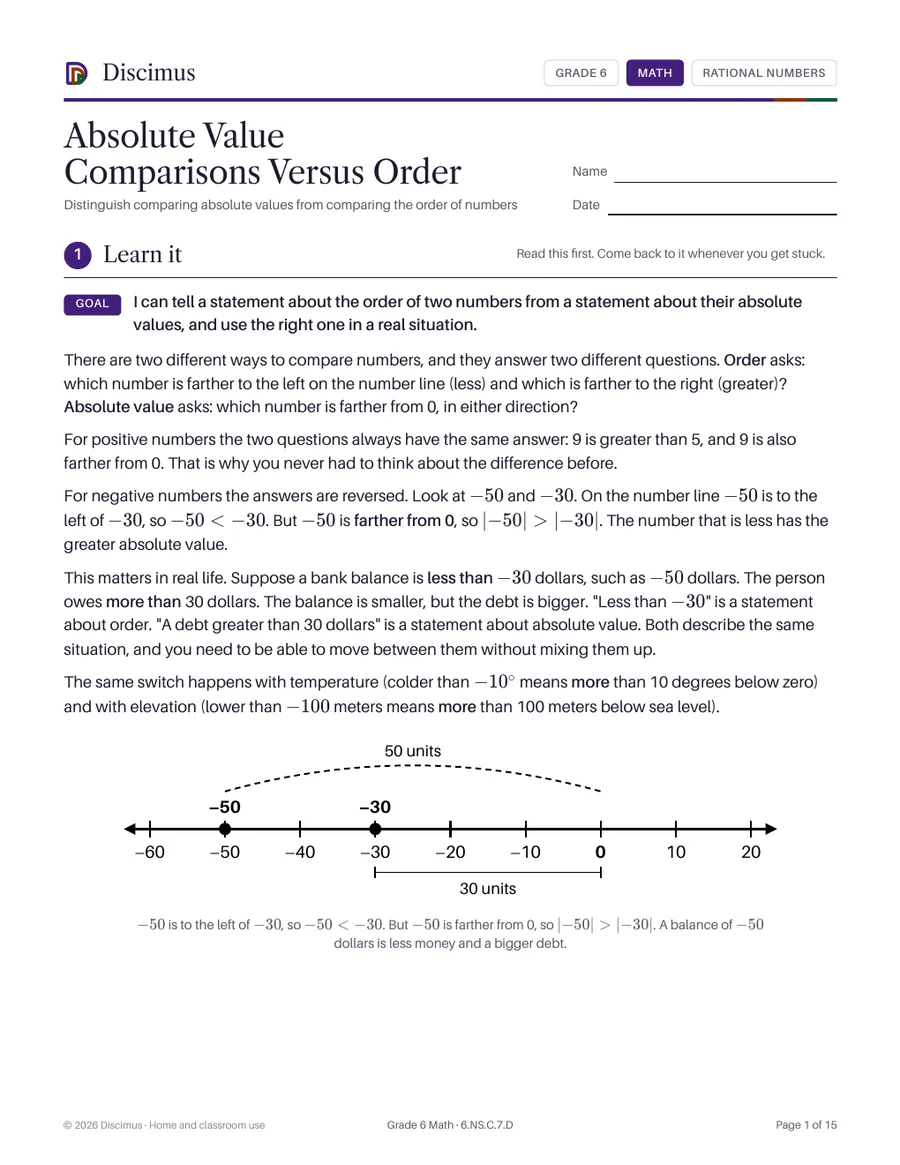
Absolute Value Comparisons Versus Order
Distinguish comparing absolute values from comparing the order of numbers
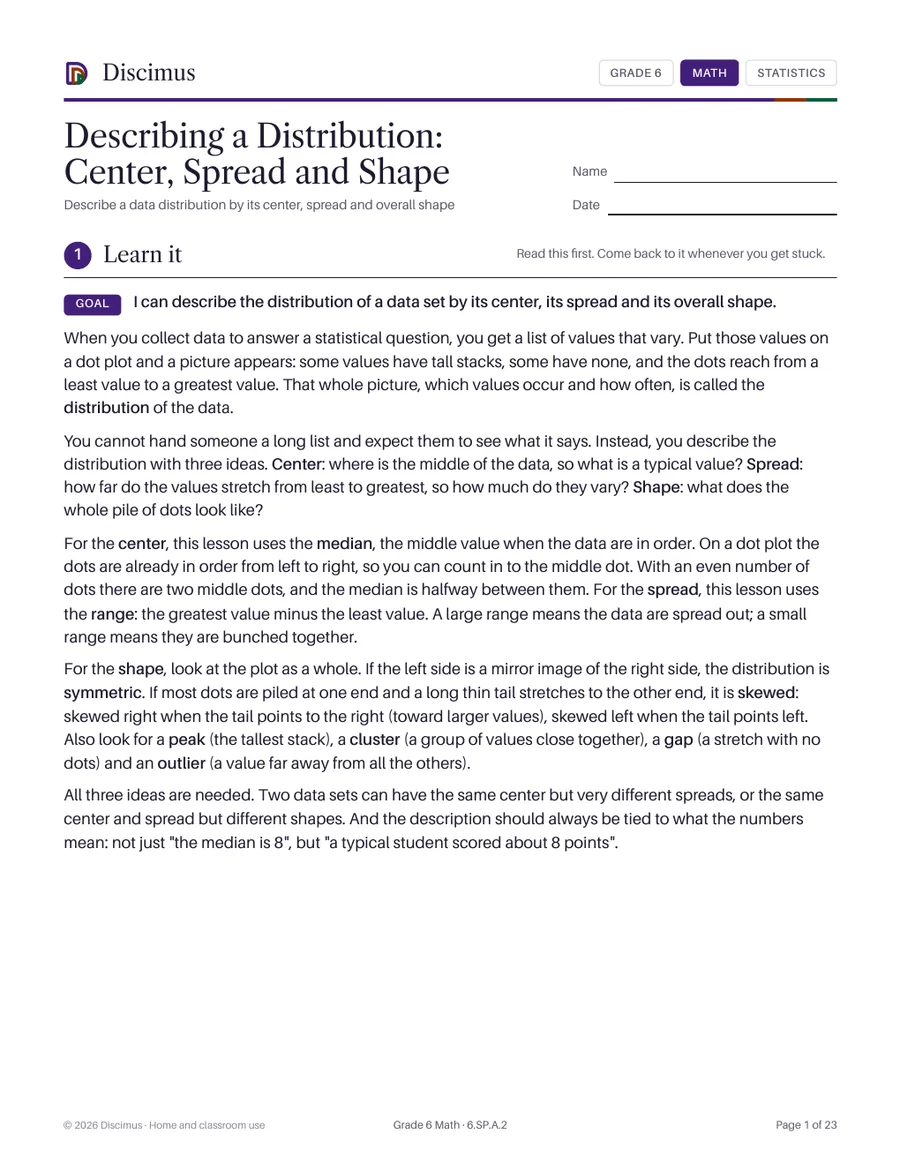
A full lesson on seeing a data set as a distribution and describing it by its center, spread and overall shape. Dot plots teach median, range, symmetry, skew, clusters, gaps and outliers, followed by 29 practice problems and 10 story problems.
For members. Join for $119.88 a year to download every Grade 6 worksheet.
Understand that data collected to answer a statistical question have a distribution that can be described by its center, spread and overall shape.
Distinguish comparing absolute values from comparing the order of numbers
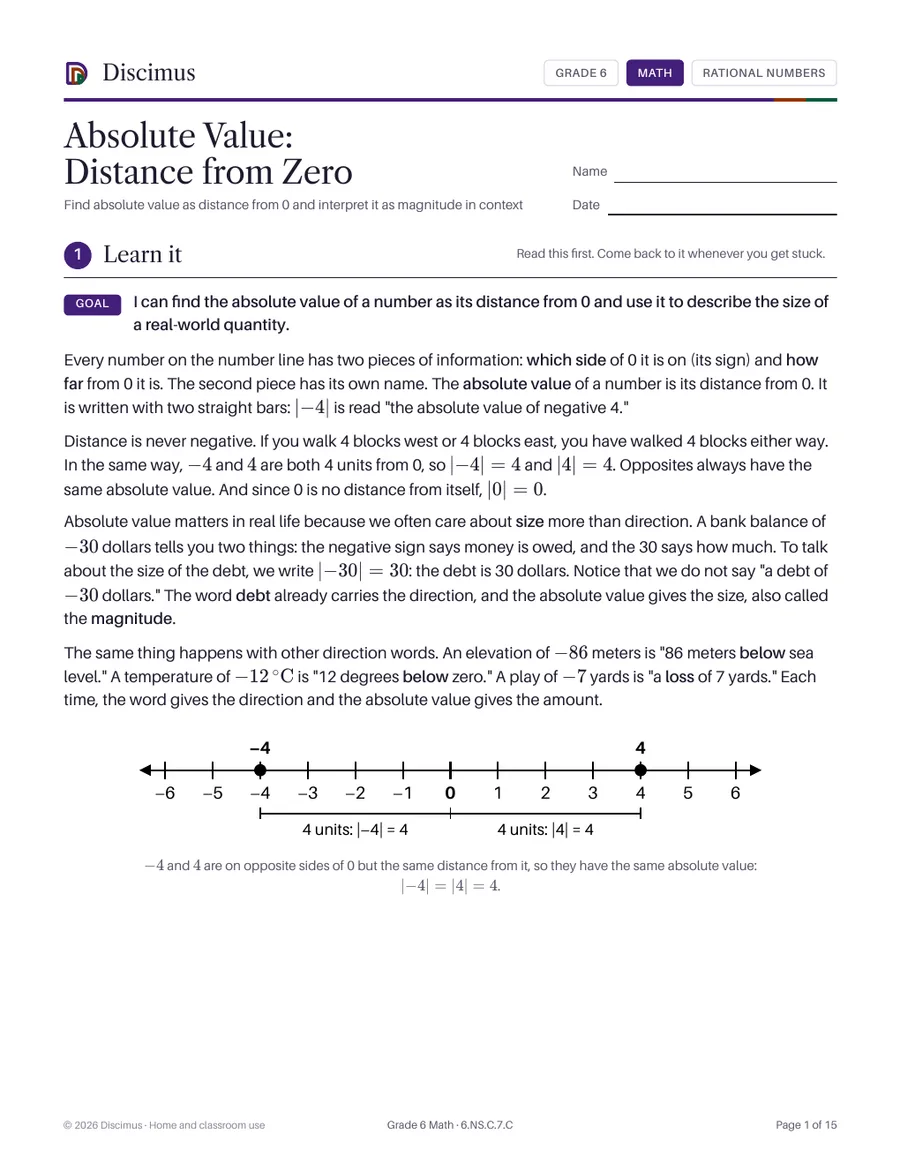
Find absolute value as distance from 0 and interpret it as magnitude in context
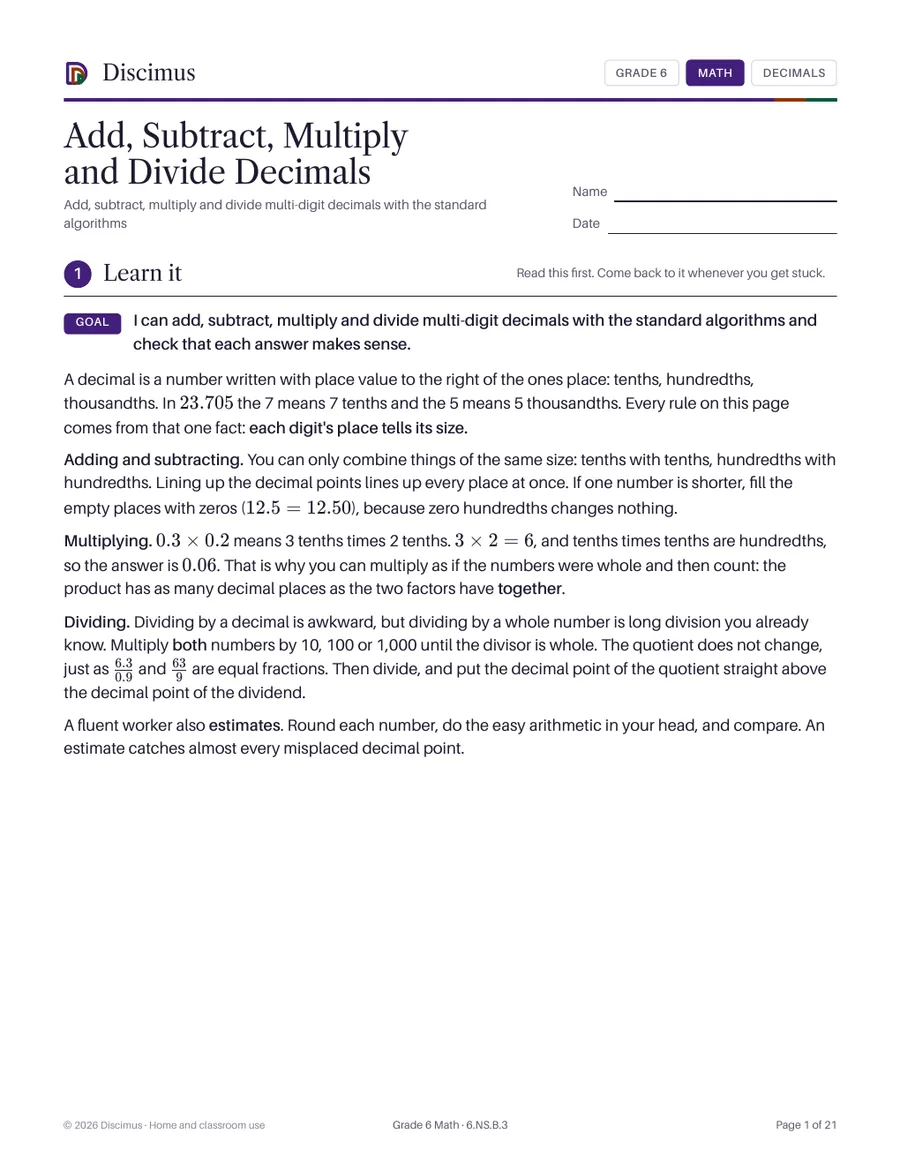
Add, subtract, multiply and divide multi-digit decimals with the standard algorithms
Find areas of triangles, quadrilaterals and polygons by composing and decomposing