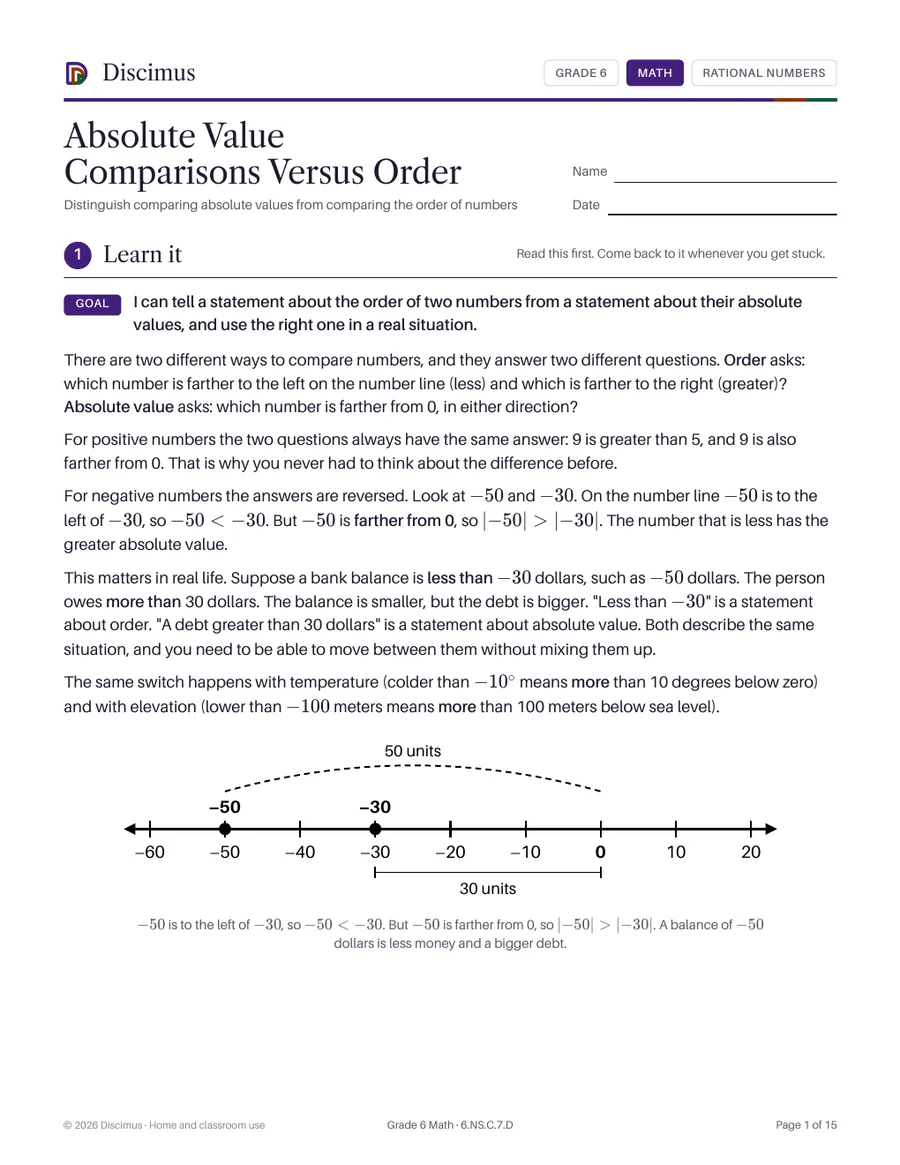
Absolute Value Comparisons Versus Order
Distinguish comparing absolute values from comparing the order of numbers
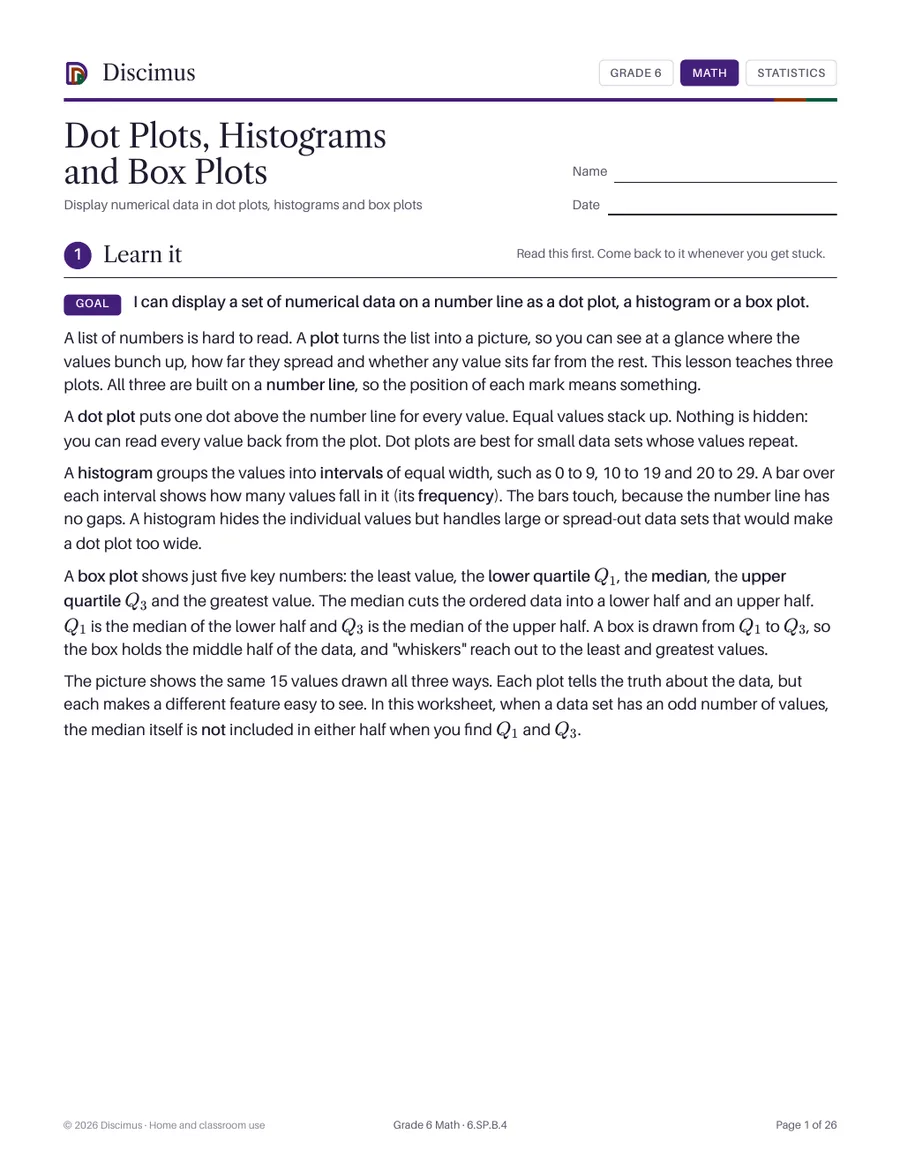
A full lesson on displaying numerical data on a number line. It teaches how to build a dot plot, a histogram and a box plot step by step, with three worked examples, then 25 practice problems with ready-made axes and 11 story problems.
For members. Join for $119.88 a year to download every Grade 6 worksheet.
Show numerical data in plots on a number line, including dot plots, histograms and box plots.
Distinguish comparing absolute values from comparing the order of numbers
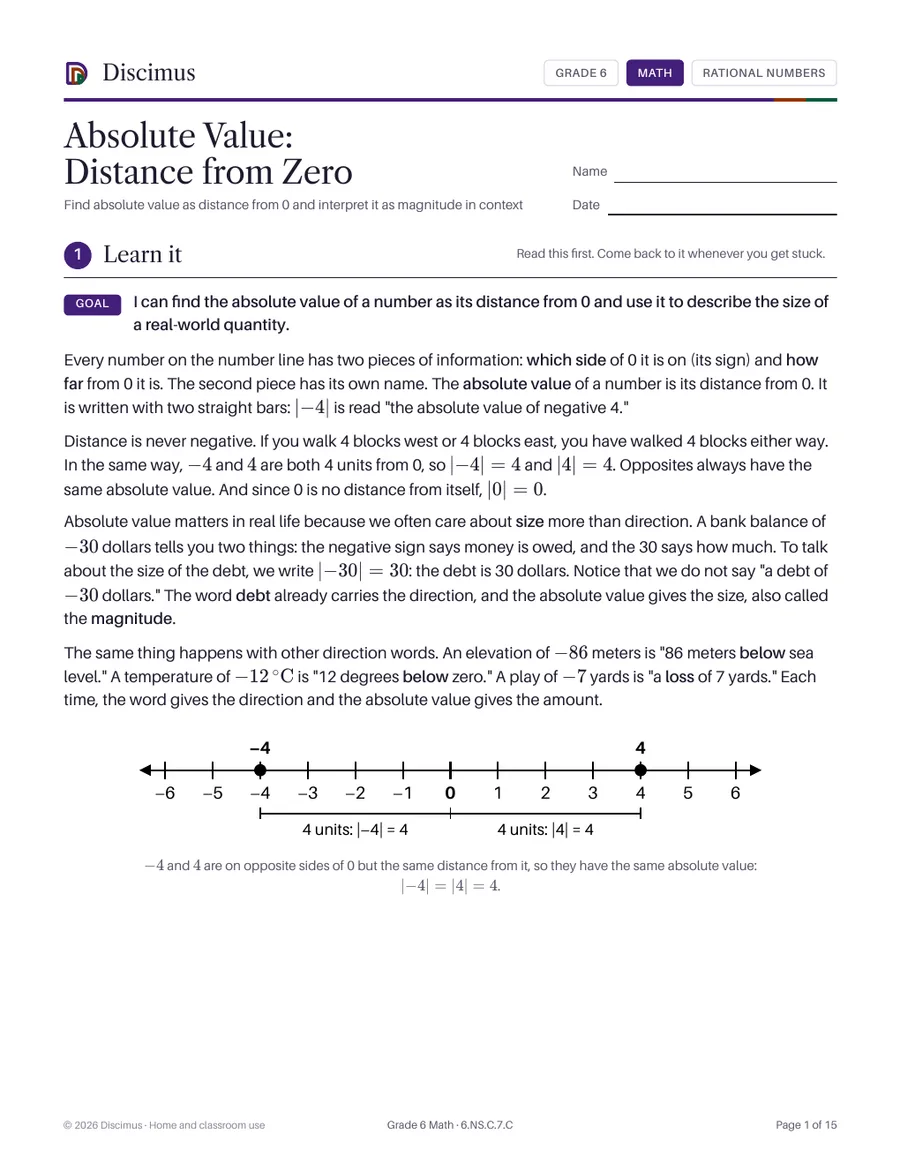
Find absolute value as distance from 0 and interpret it as magnitude in context
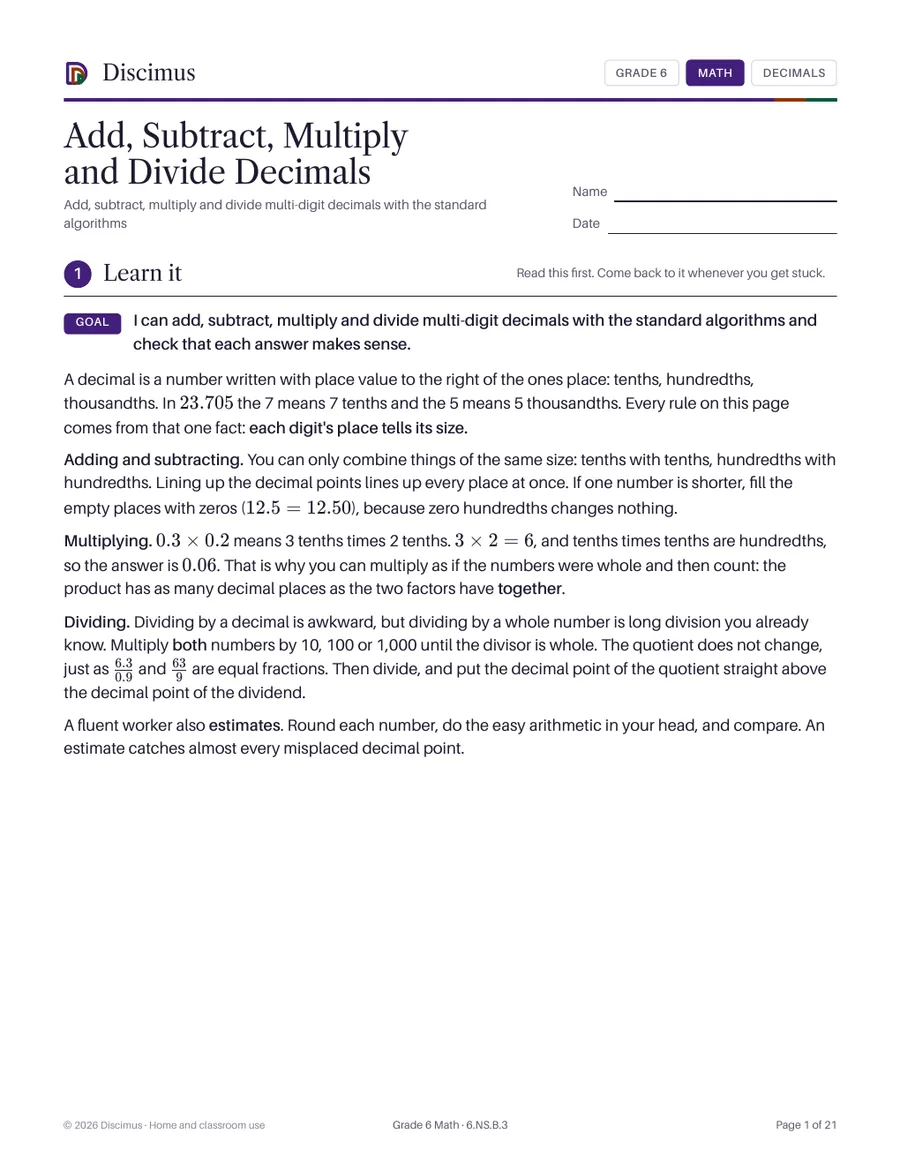
Add, subtract, multiply and divide multi-digit decimals with the standard algorithms
Find areas of triangles, quadrilaterals and polygons by composing and decomposing