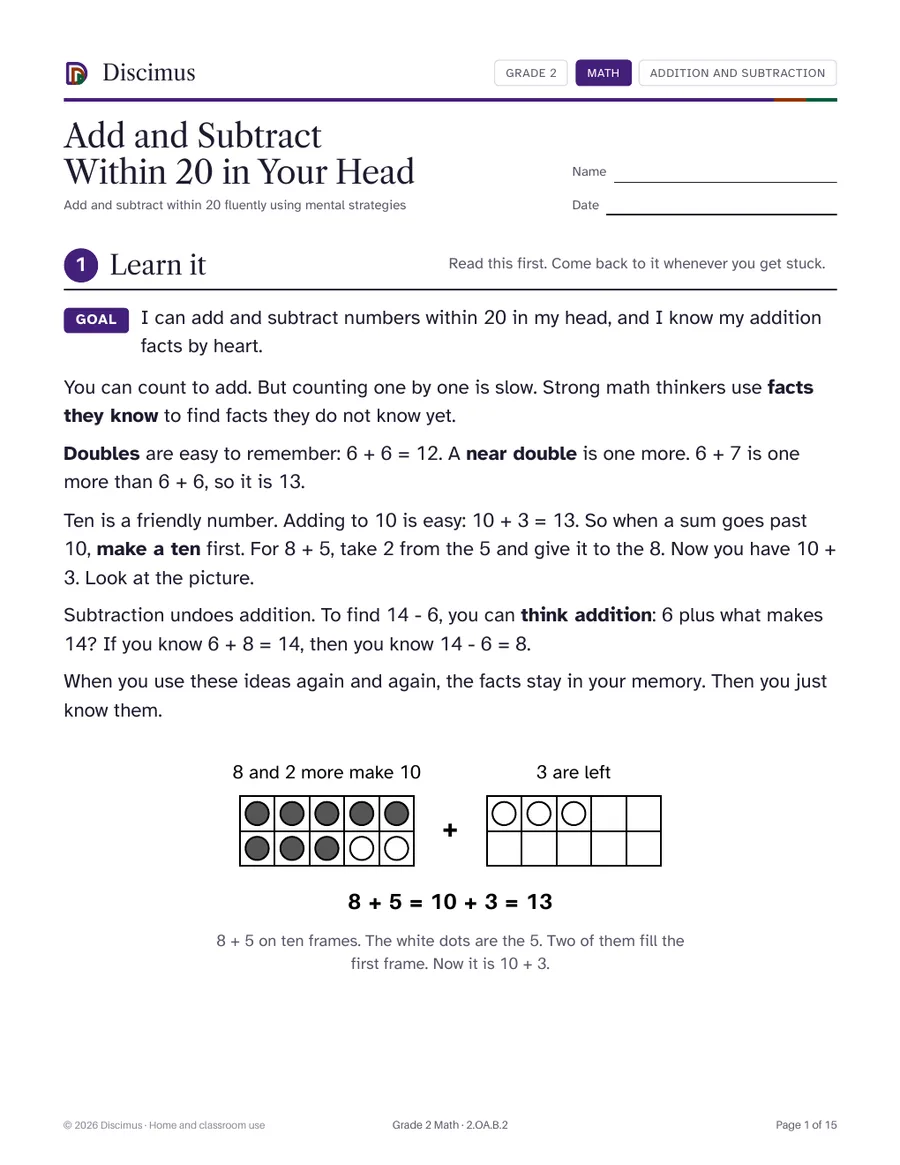
Add and Subtract Within 20 in Your Head
Add and subtract within 20 fluently using mental strategies
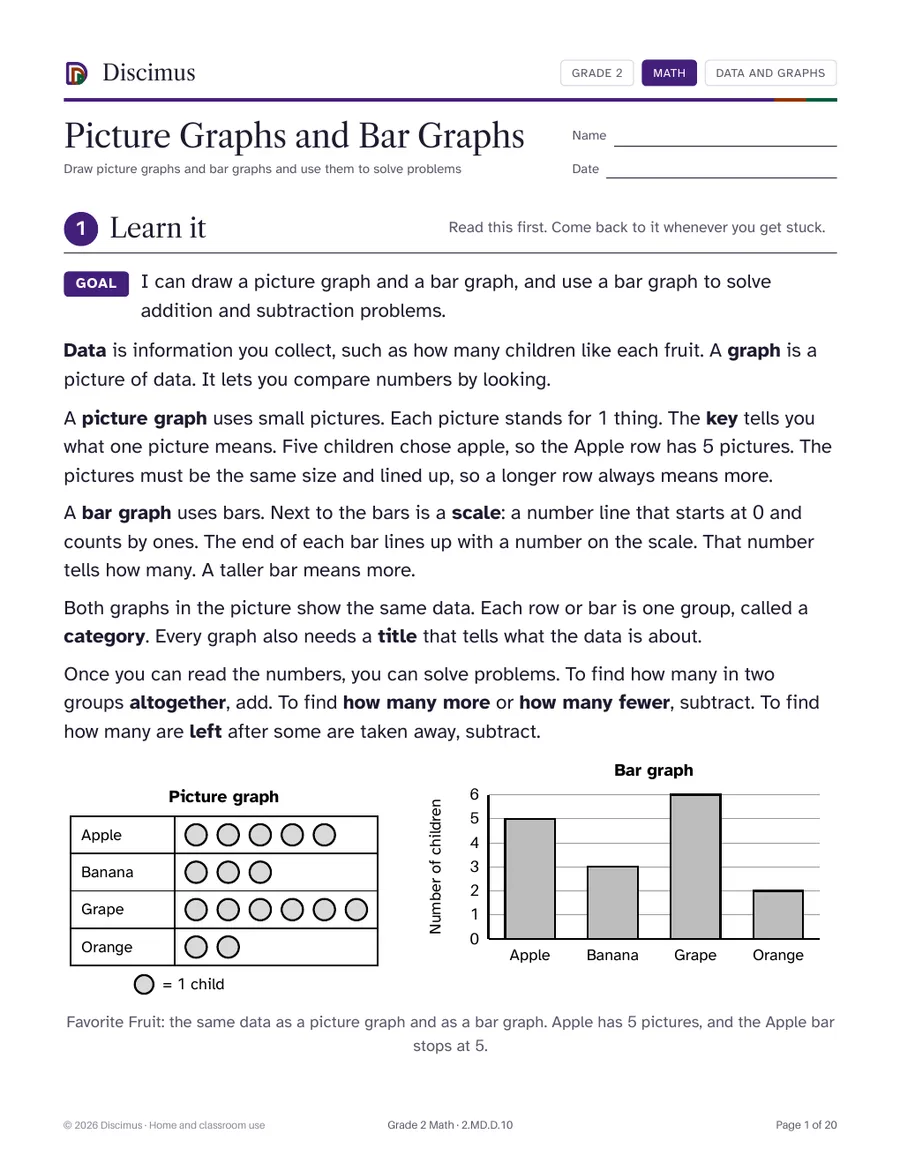
A full lesson on drawing picture graphs and bar graphs for data with up to four categories, then using a graph to solve put-together, take-apart and compare problems. 27 drill problems and 12 story problems.
For members. Join for $119.88 a year to download every Grade 2 worksheet.
Draw a picture graph and a bar graph with a single-unit scale for data with up to four categories, and use a bar graph to solve put-together, take-apart and compare problems.
Add and subtract within 20 fluently using mental strategies
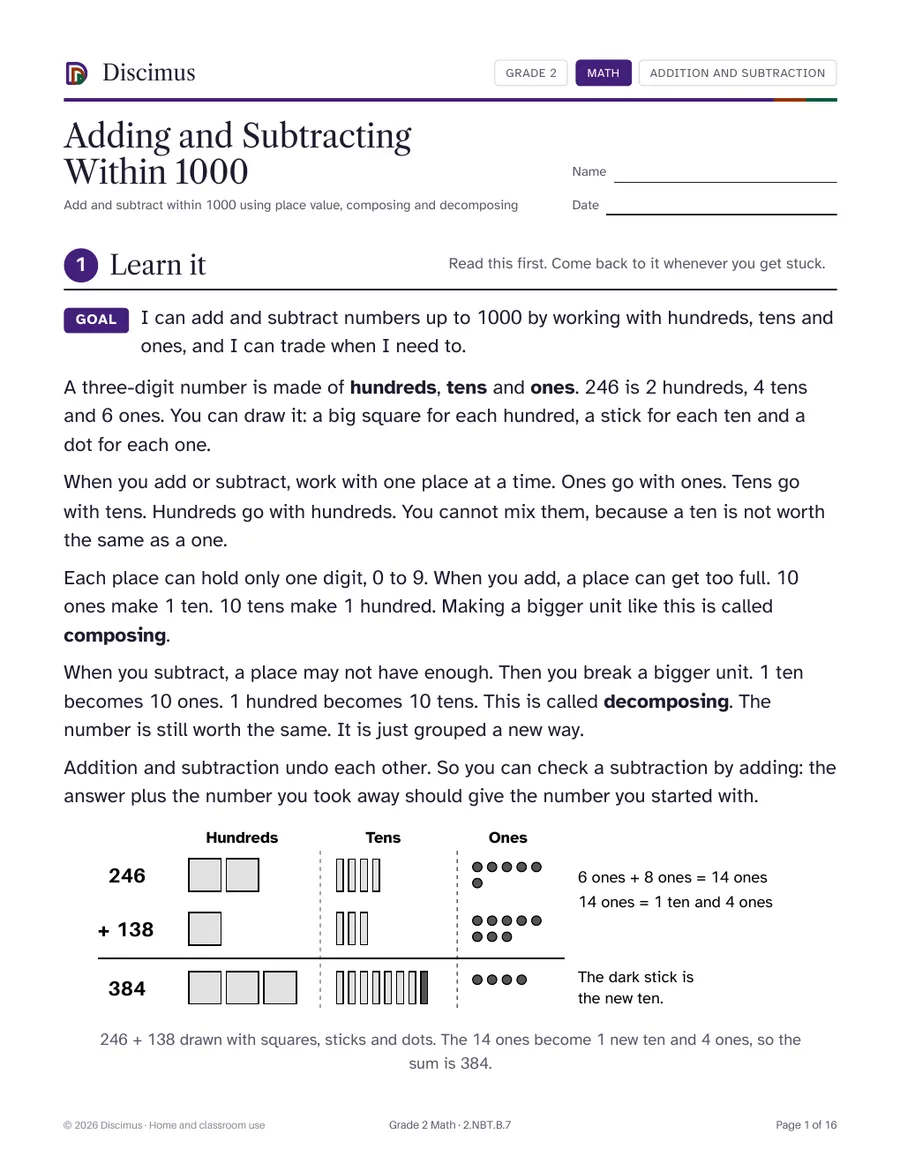
Add and subtract within 1000 using place value, composing and decomposing
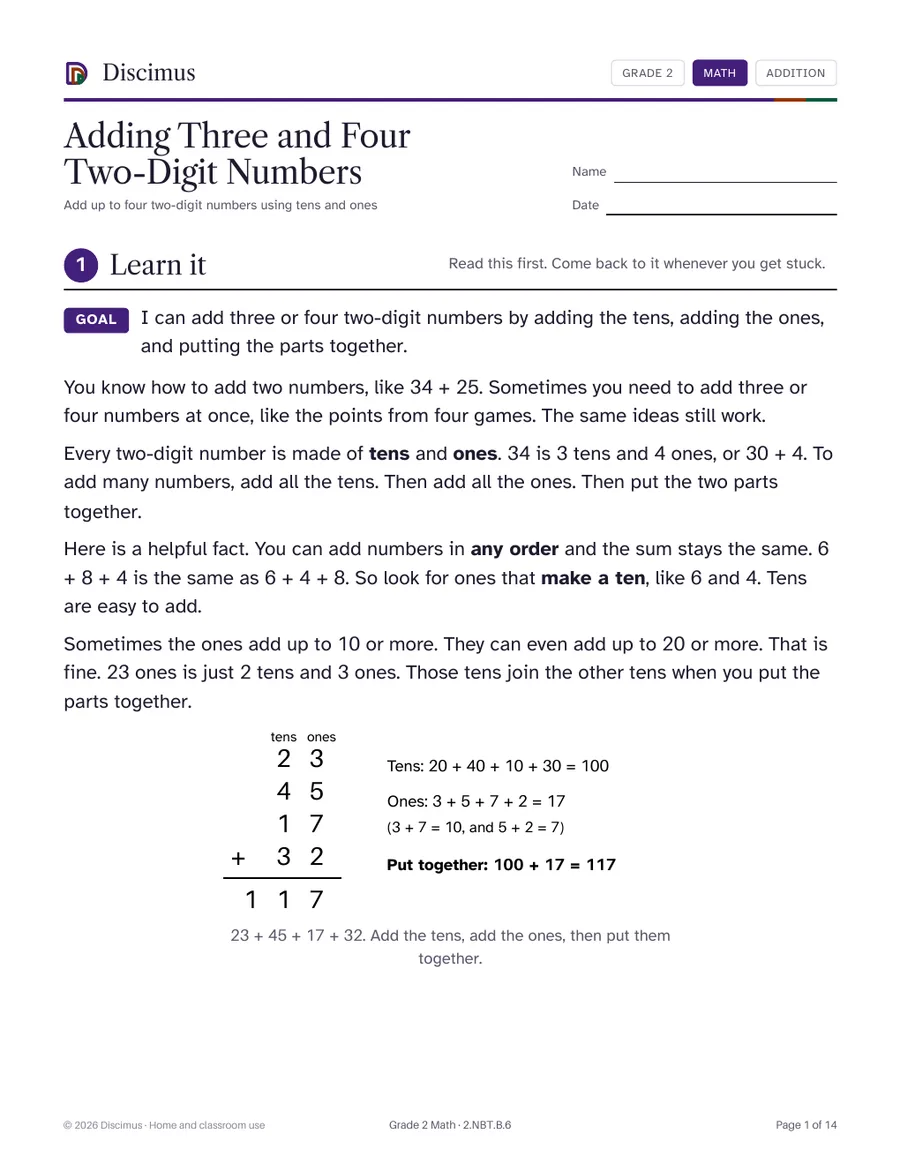
Add up to four two-digit numbers using tens and ones
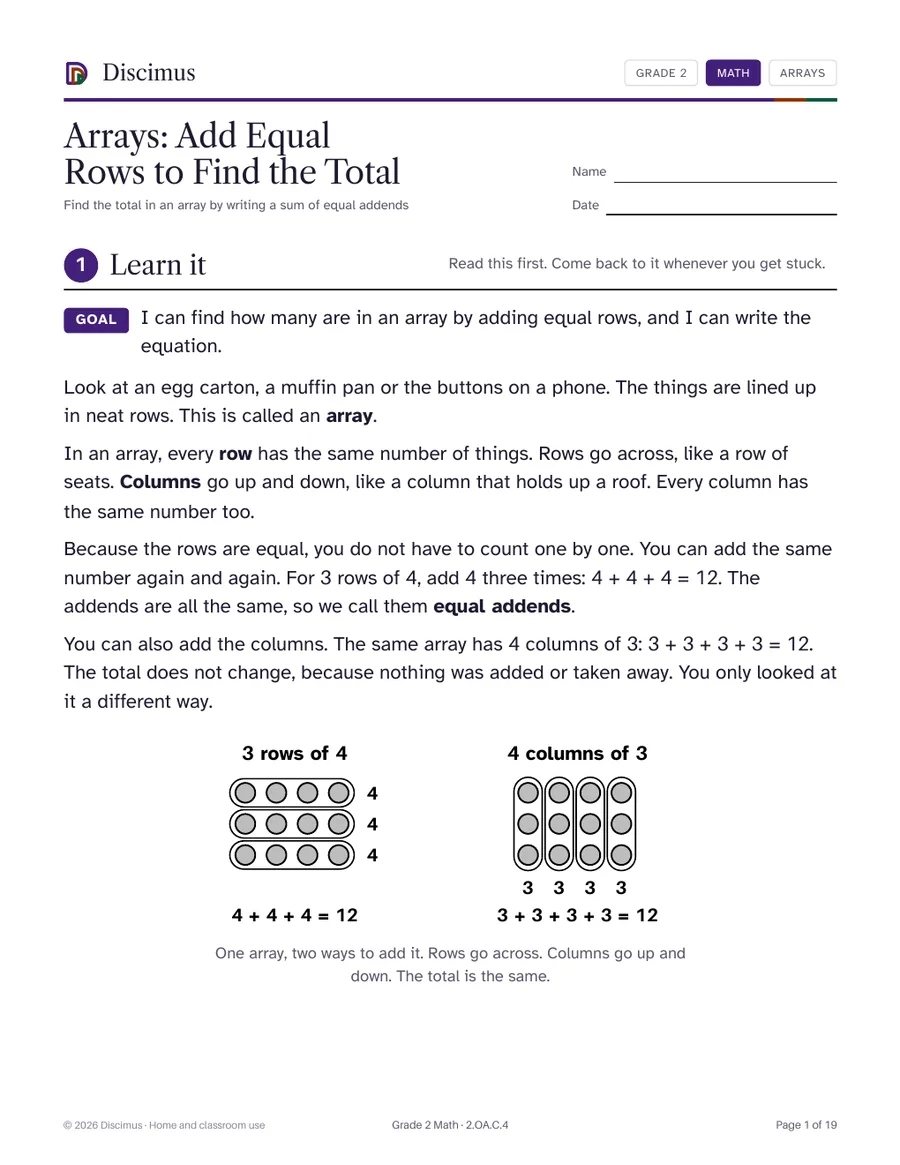
Find the total in an array by writing a sum of equal addends