Add, Subtract, Factor and Expand Linear Expressions
Add, subtract, factor and expand linear expressions with rational coefficients
A full lesson on proportional relationships: what the constant k means and how to find it in a table, a graph, an equation and a story, with four worked examples and hinted problems, then 22 drill problems and 12 story problems.
Create a free account and verify your email to download this sample. Includes the answer key.
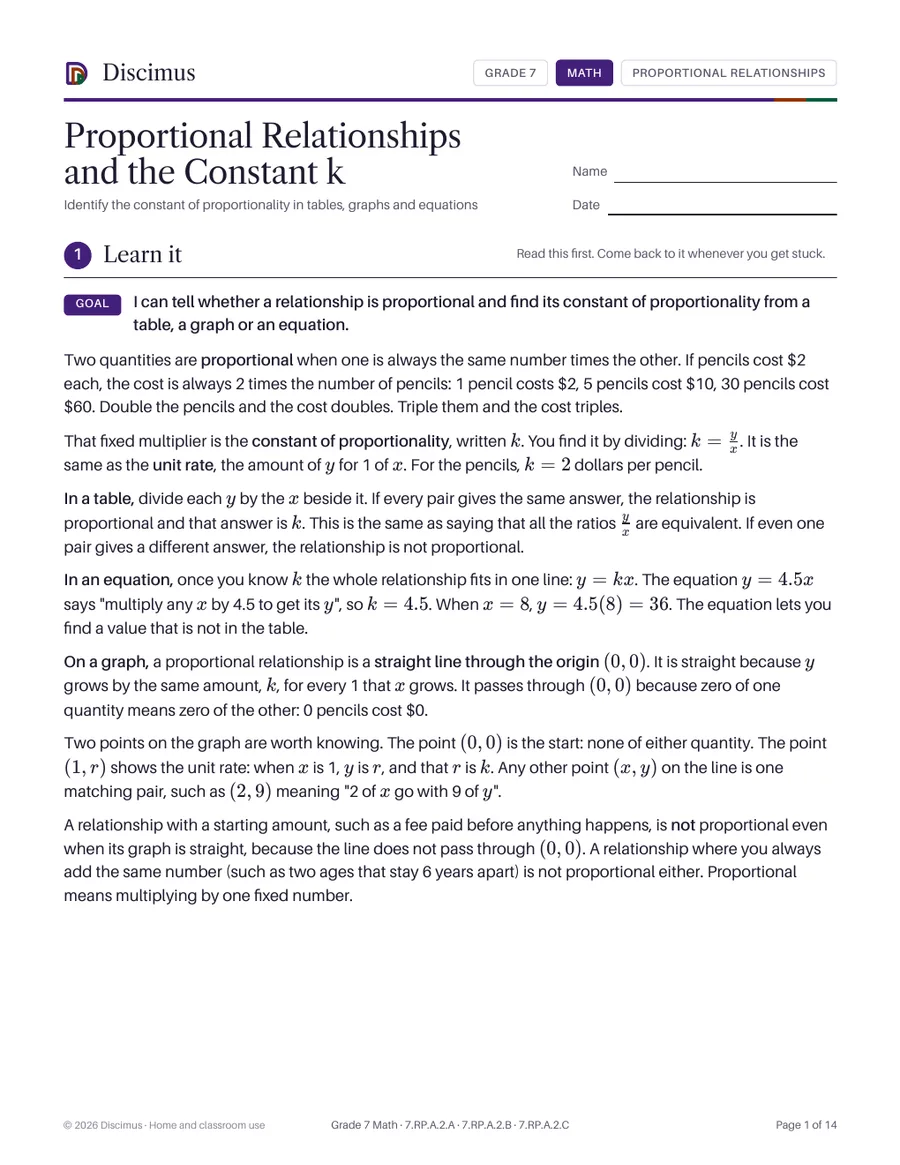
Decide whether two quantities are in a proportional relationship, for example by testing for equivalent ratios in a table.
Identify the constant of proportionality in tables, graphs, equations and verbal descriptions.
Represent proportional relationships by equations.
Explain what a point on the graph of a proportional relationship means, especially the points (0, 0) and (1, r).
Add, subtract, factor and expand linear expressions with rational coefficients
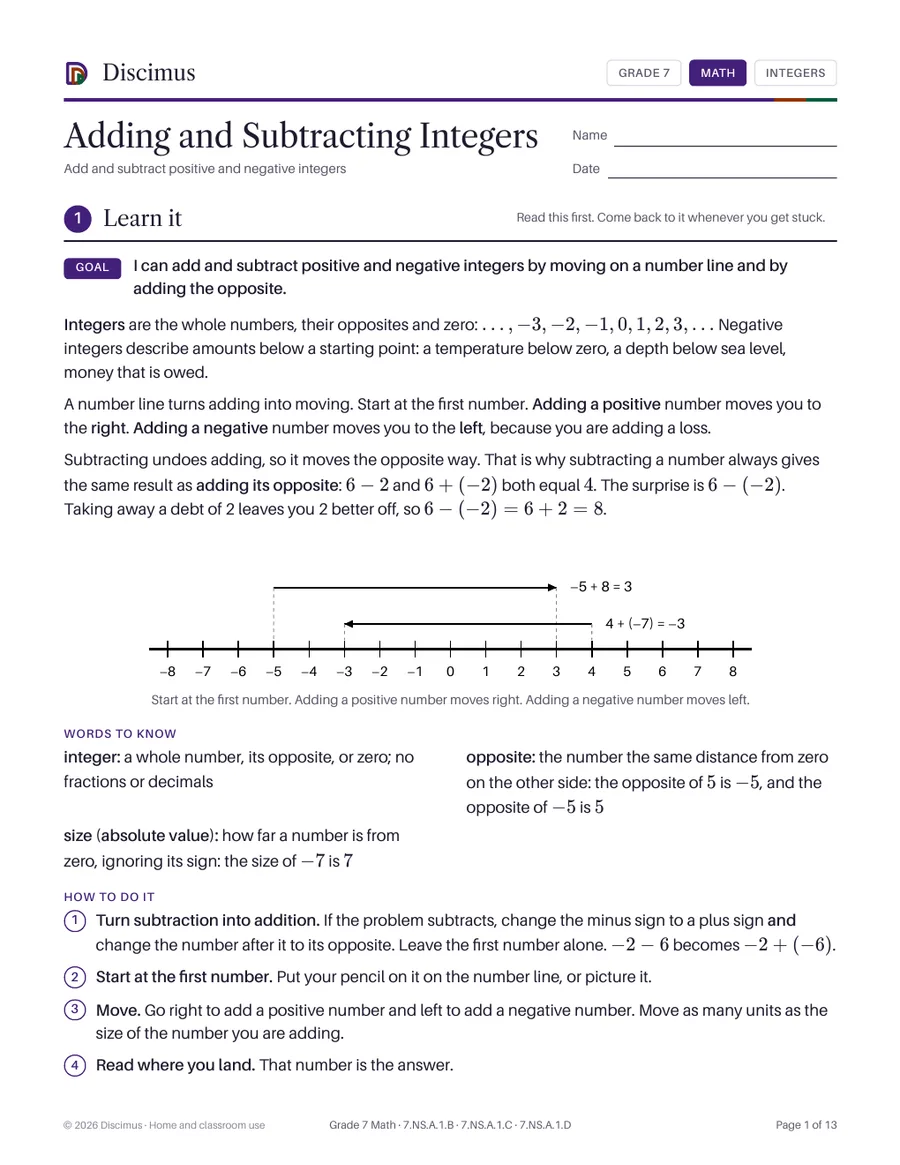
Add and subtract positive and negative integers
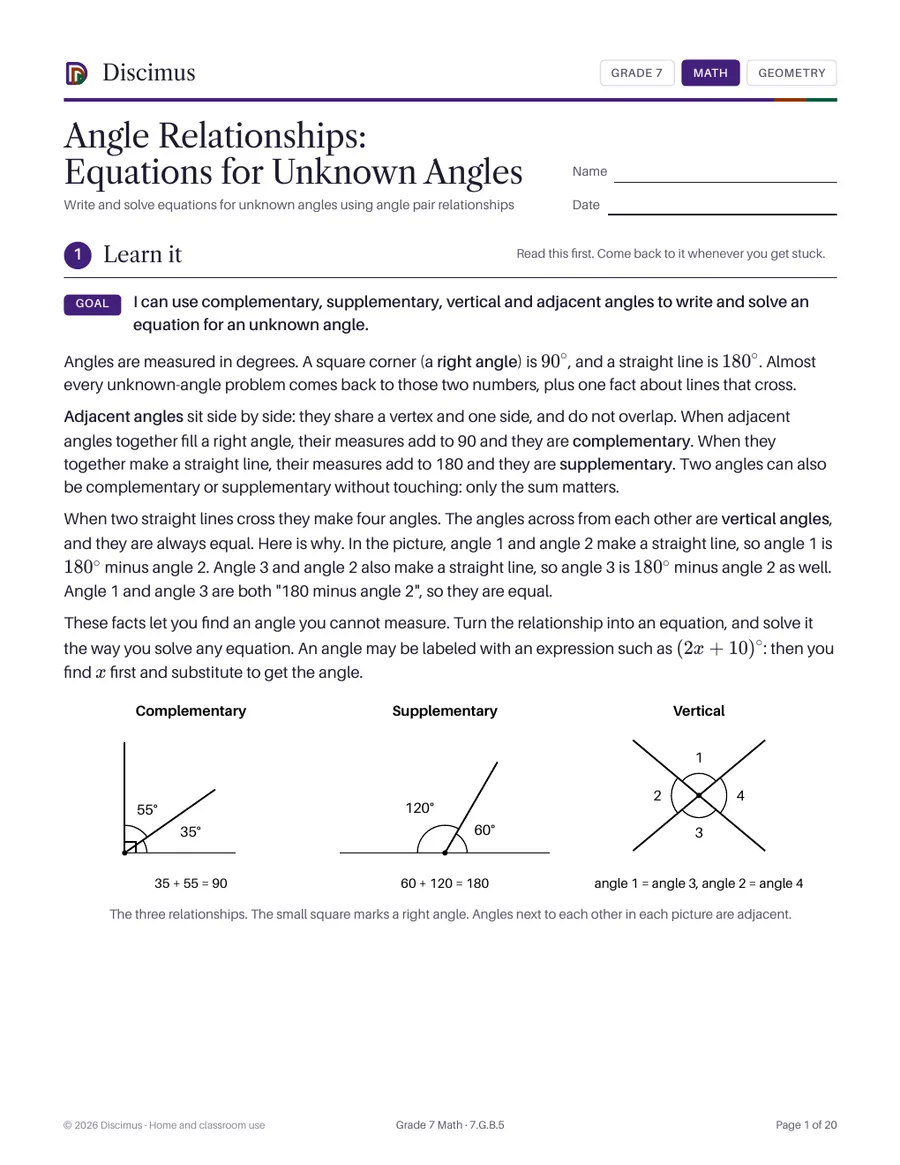
Write and solve equations for unknown angles using angle pair relationships
Find area, volume and surface area of composite figures, cubes and right prisms