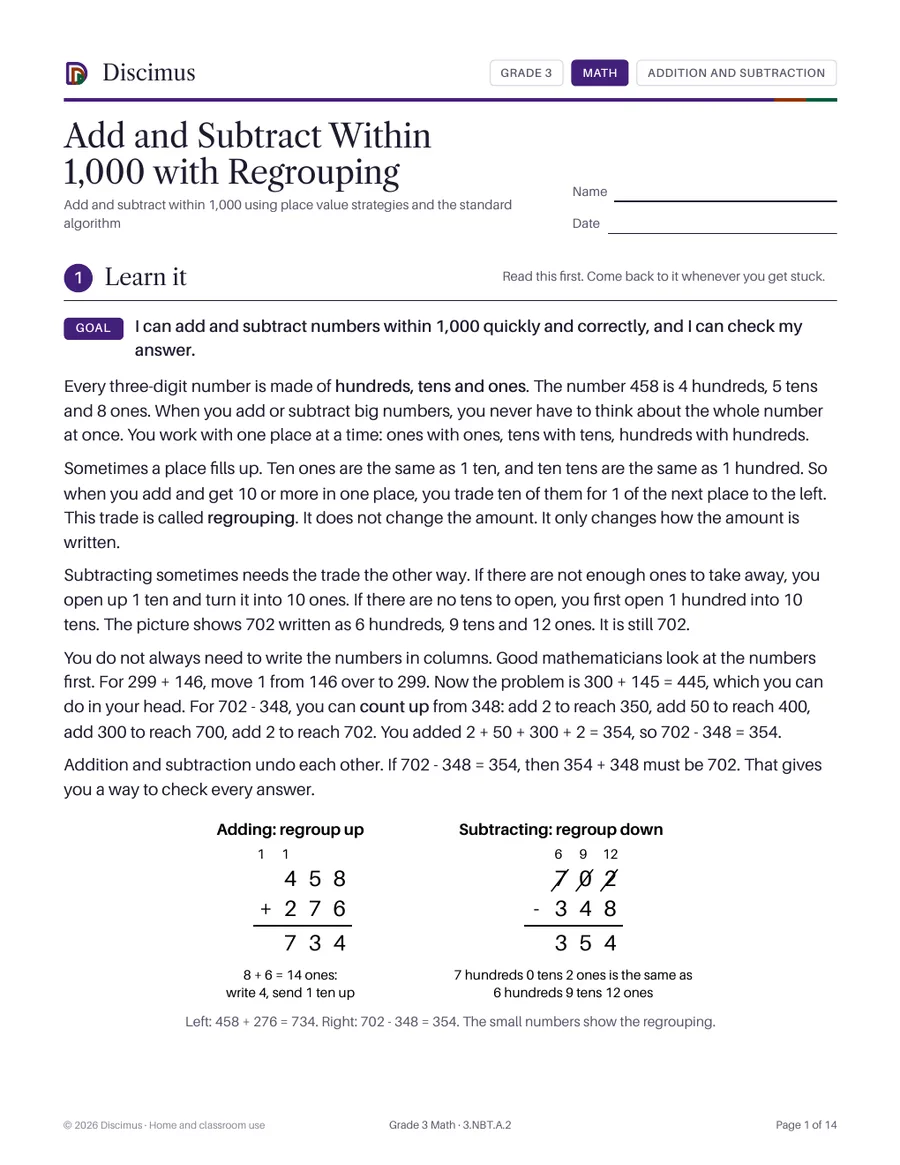
Add and Subtract Within 1,000 with Regrouping
Add and subtract within 1,000 using place value strategies and the standard algorithm
Teaches how to read and draw picture graphs and bar graphs where each symbol or grid line stands for more than one, then how to answer how many more and how many fewer questions. 28 practice problems and 10 story problems, all with graphs.
For members. Join for $119.88 a year to download every Grade 3 worksheet.
Draw a scaled picture graph and a scaled bar graph for data with several categories, and use scaled bar graphs to solve one-step and two-step how many more and how many less problems.
Add and subtract within 1,000 using place value strategies and the standard algorithm
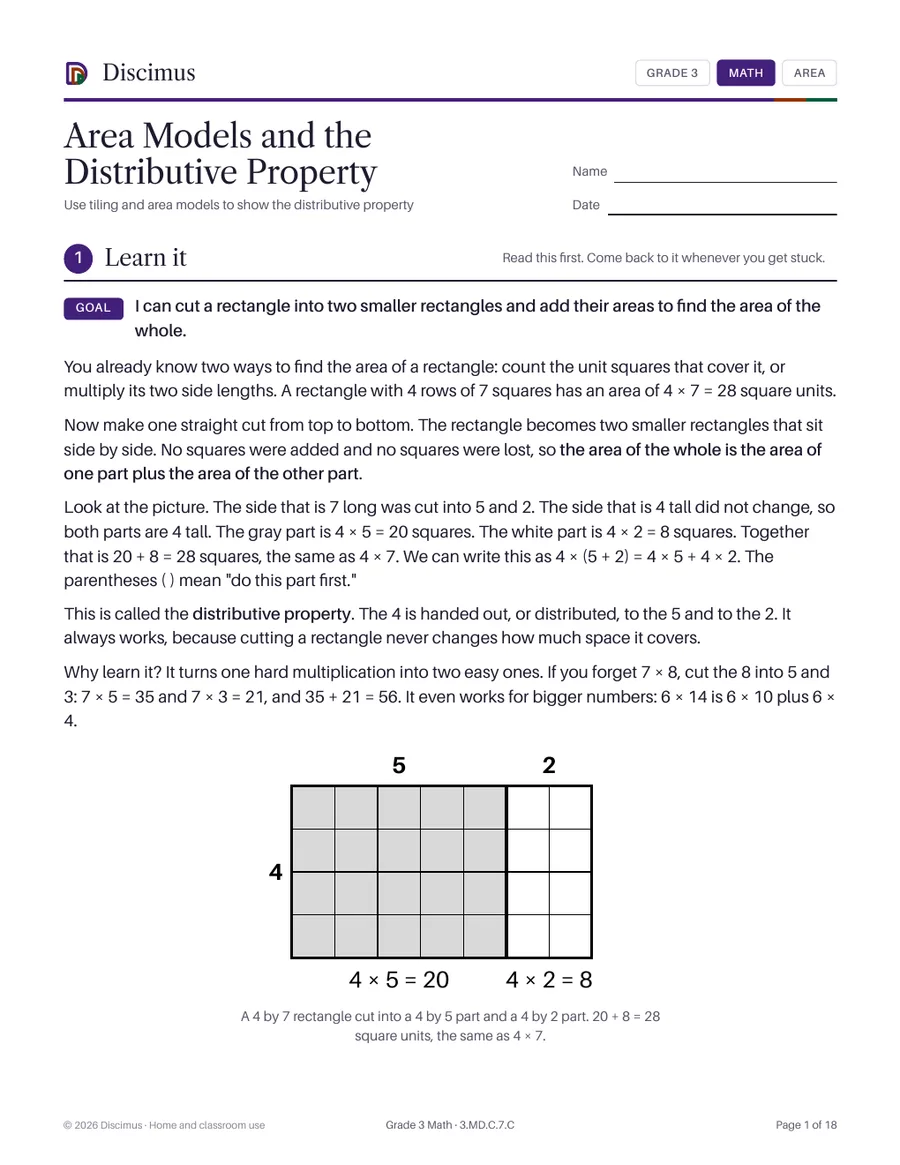
Use tiling and area models to show the distributive property
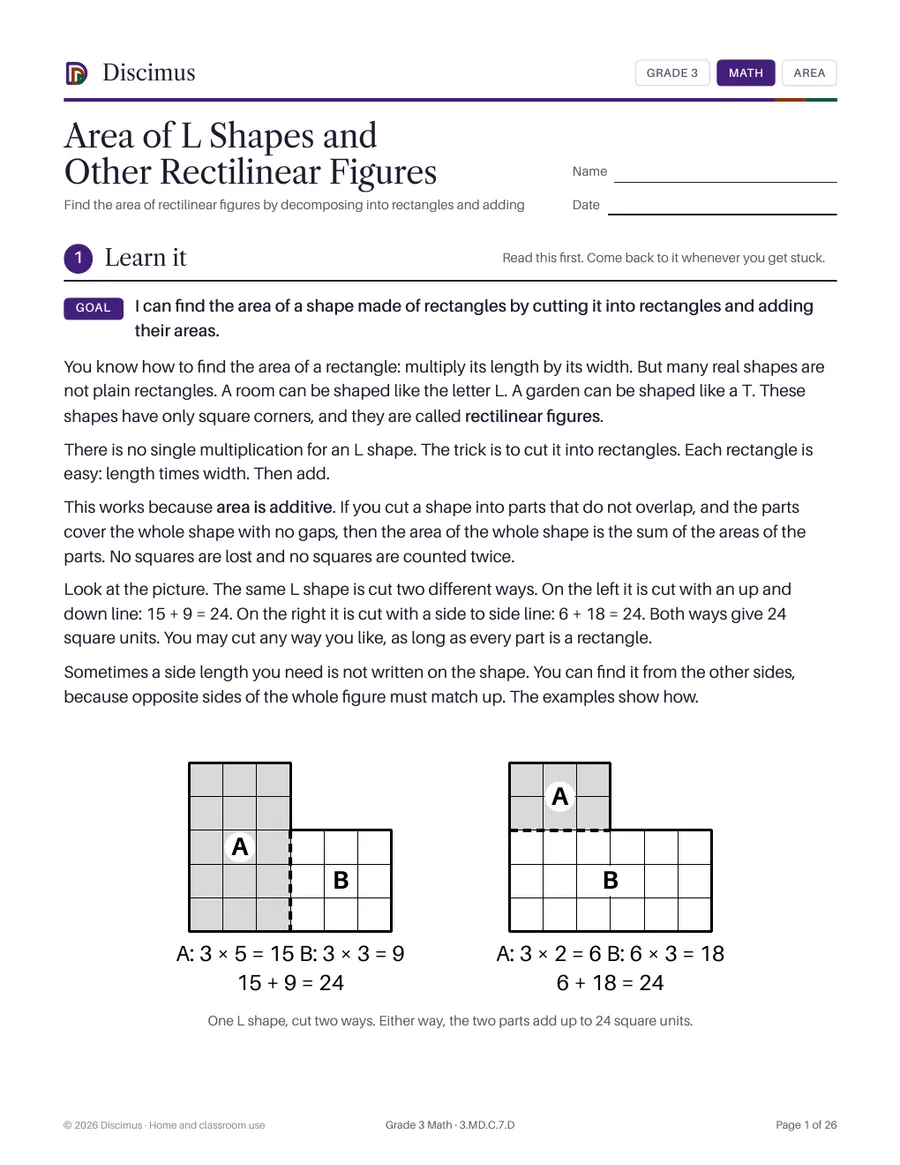
Find the area of rectilinear figures by decomposing into rectangles and adding
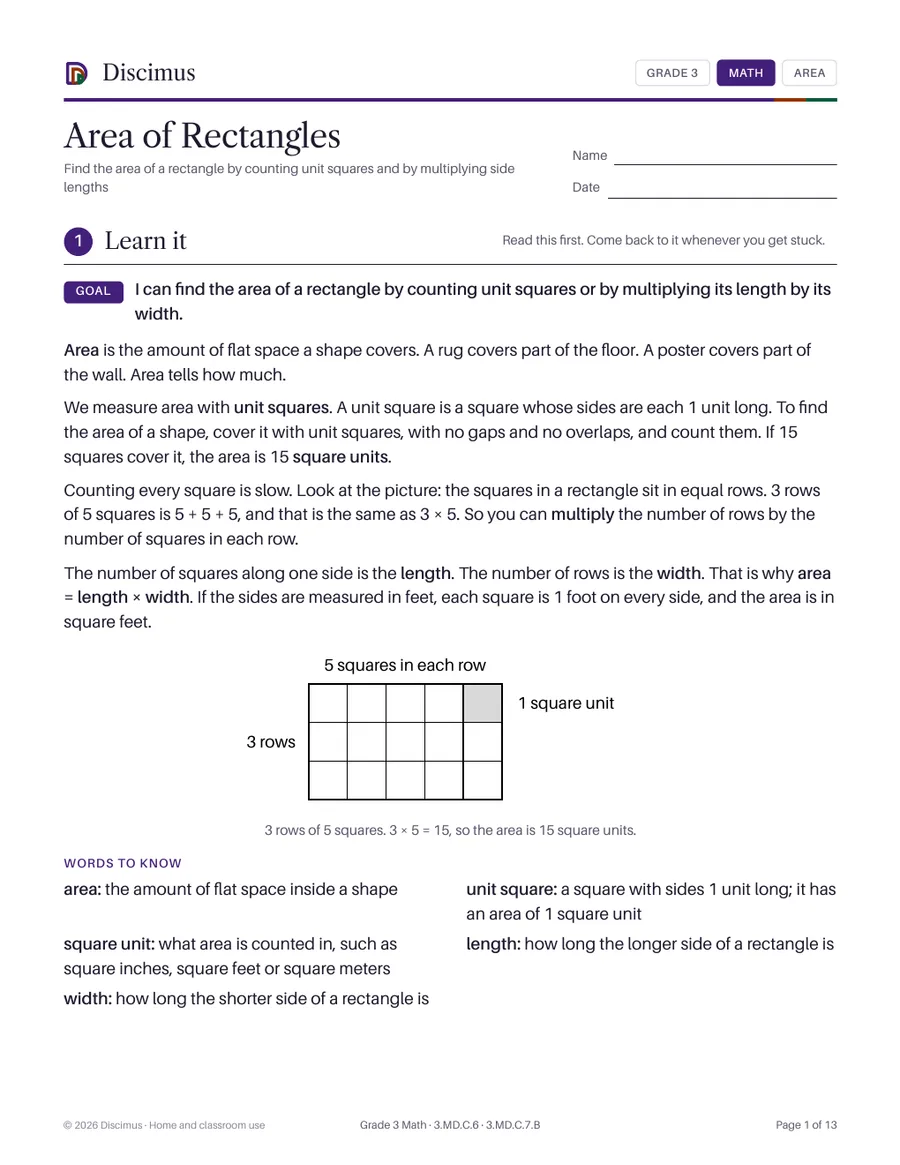
Find the area of a rectangle by counting unit squares and by multiplying side lengths