Average Rate of Change Over an Interval
Calculate, estimate and interpret average rate of change over an interval
11 worksheets match.
Calculate, estimate and interpret average rate of change over an interval
Compare properties of two functions given in different representations
Write a linear or exponential function from a table, graph, description or two points
Relate the domain of a function to its graph and to the situation it models
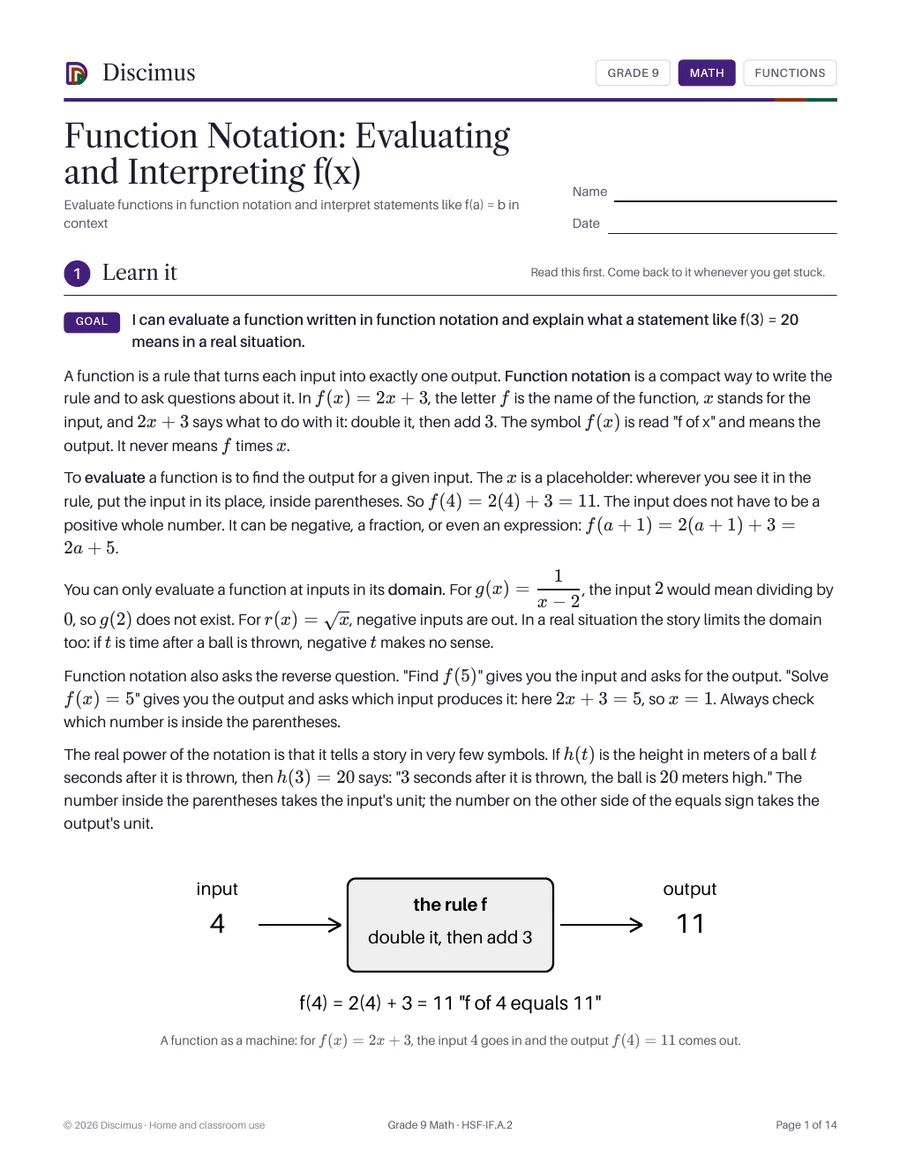
Evaluate functions in function notation and interpret statements like f(a) = b in context
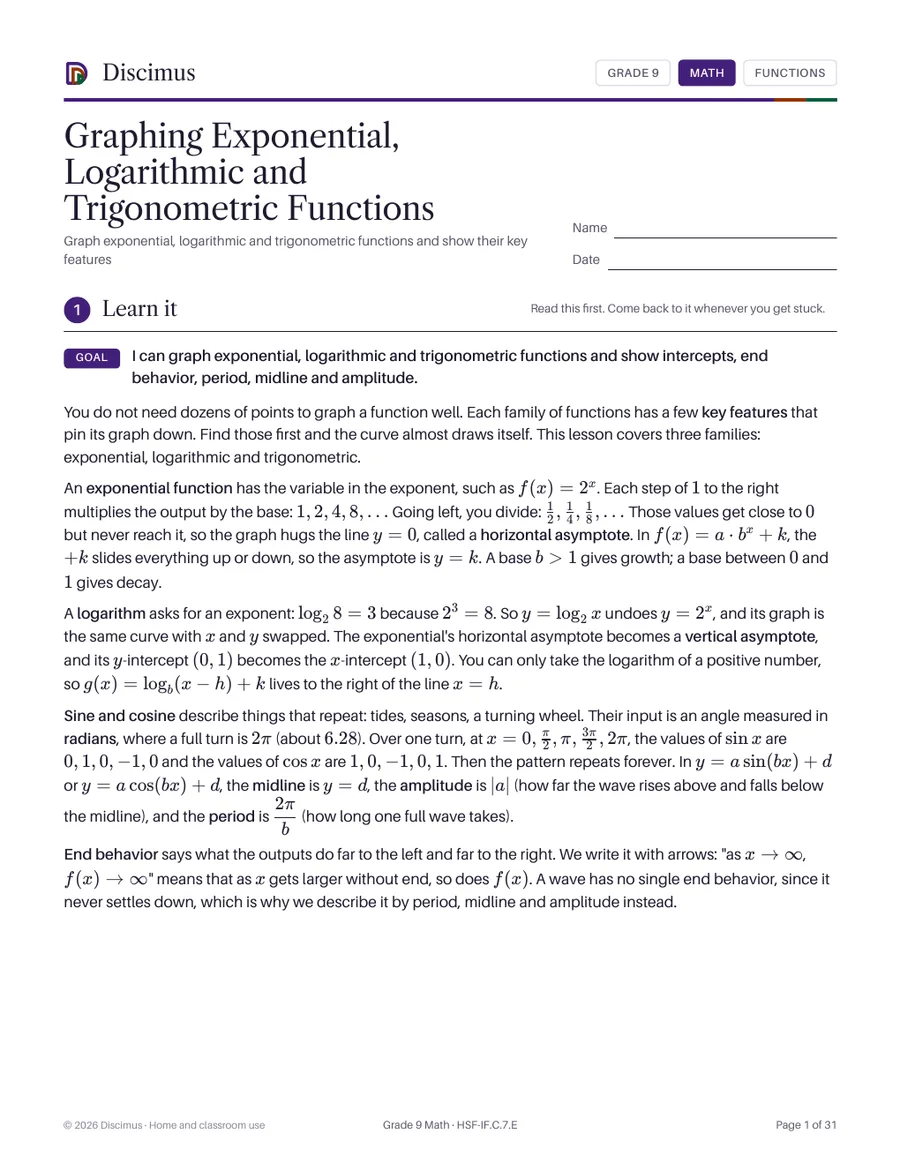
Graph exponential, logarithmic and trigonometric functions and show their key features
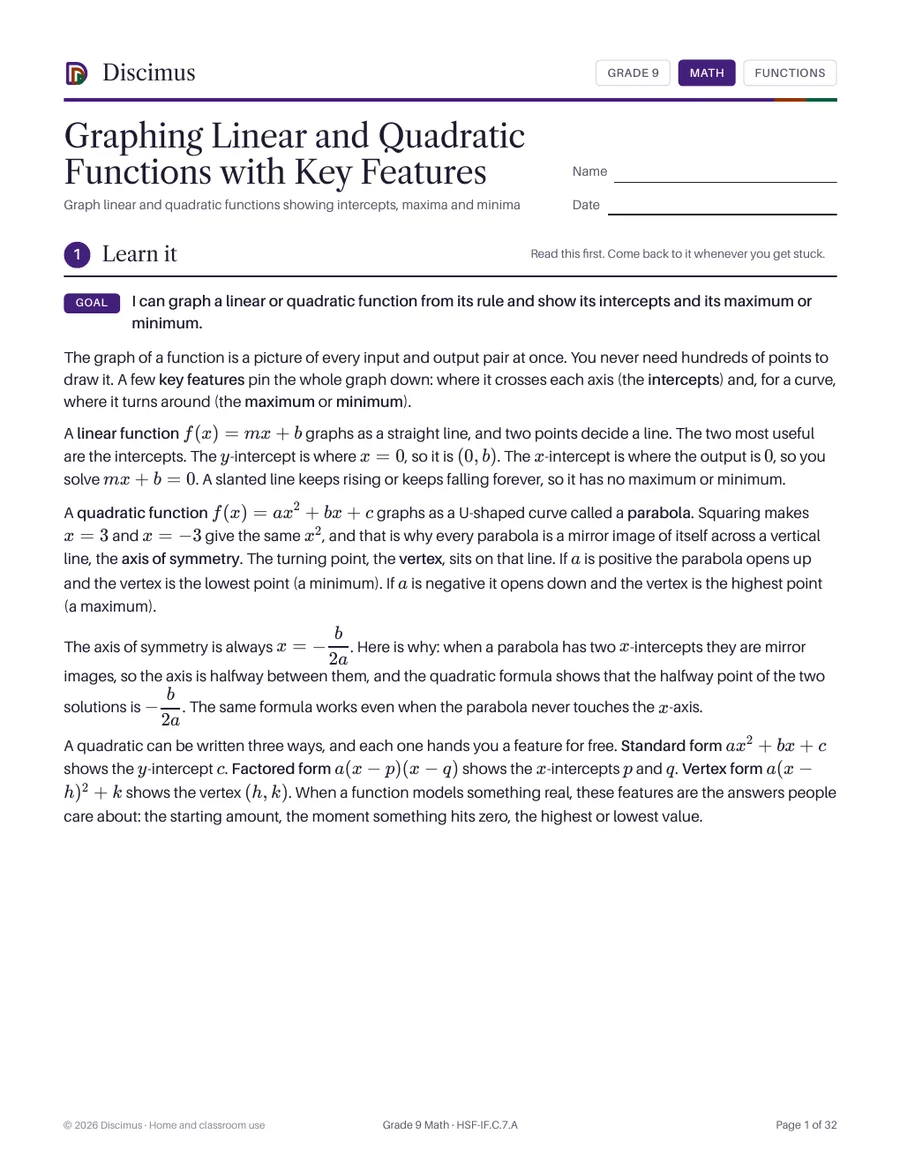
Graph linear and quadratic functions showing intercepts, maxima and minima
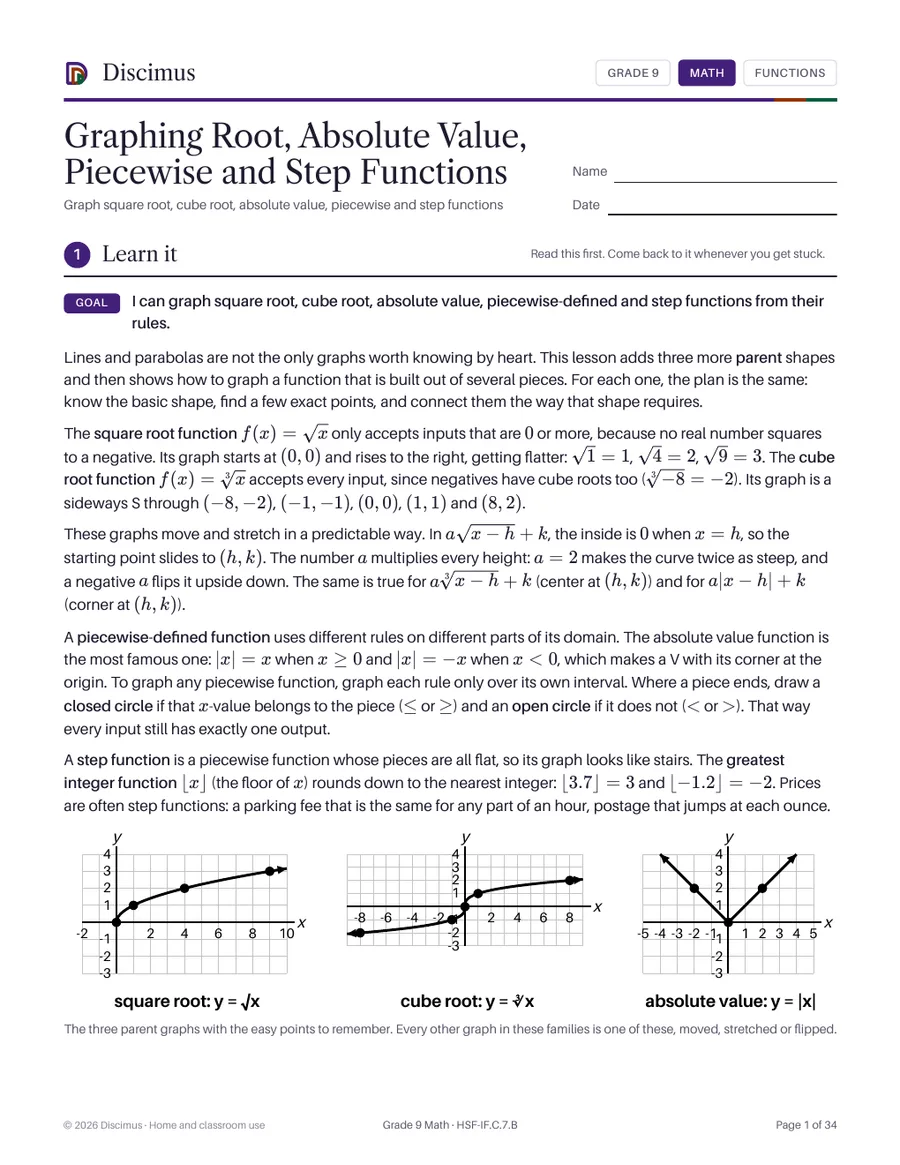
Graph square root, cube root, absolute value, piecewise and step functions
Interpret key features of graphs and tables and sketch graphs from descriptions
Interpret the parameters of a linear or exponential function in terms of its context
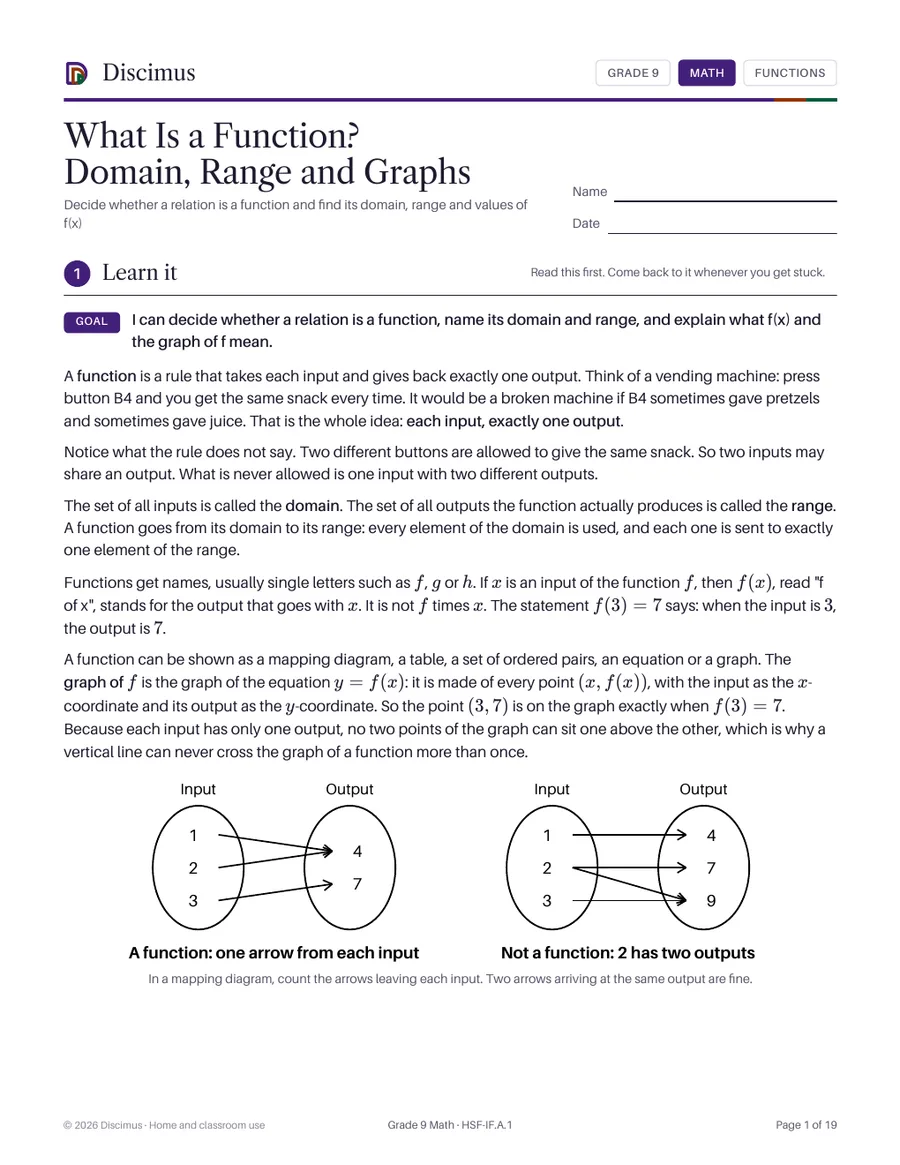
Decide whether a relation is a function and find its domain, range and values of f(x)