Comparing Data Sets: Center, Spread and Standard Deviation
Compare data sets using center and spread measures that fit the shape of the distribution
10 worksheets match.
Compare data sets using center and spread measures that fit the shape of the distribution
Distinguish between correlation and causation and evaluate causal claims
Fit a linear function to a scatter plot by eye and with technology, and write its equation
Fit linear, quadratic and exponential functions to data and use them to solve problems
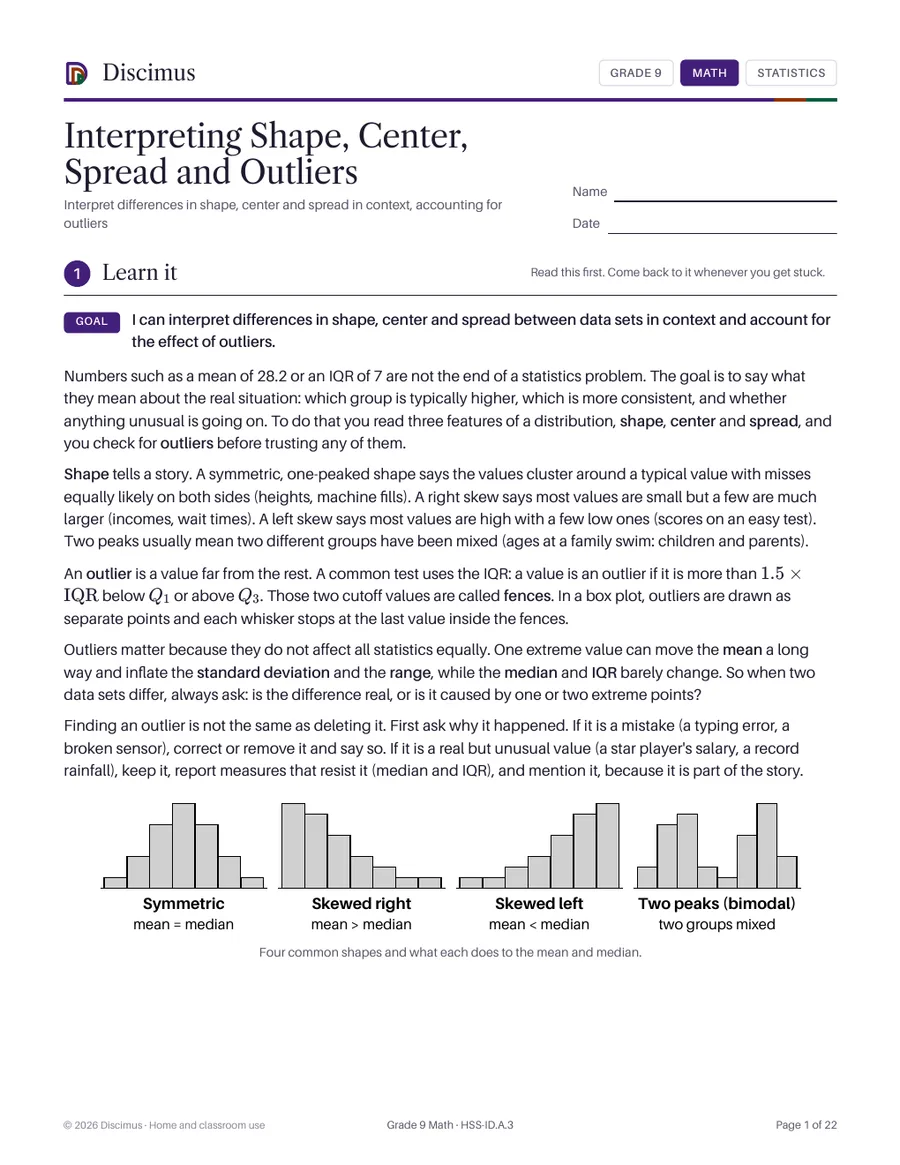
Interpret differences in shape, center and spread in context, accounting for outliers
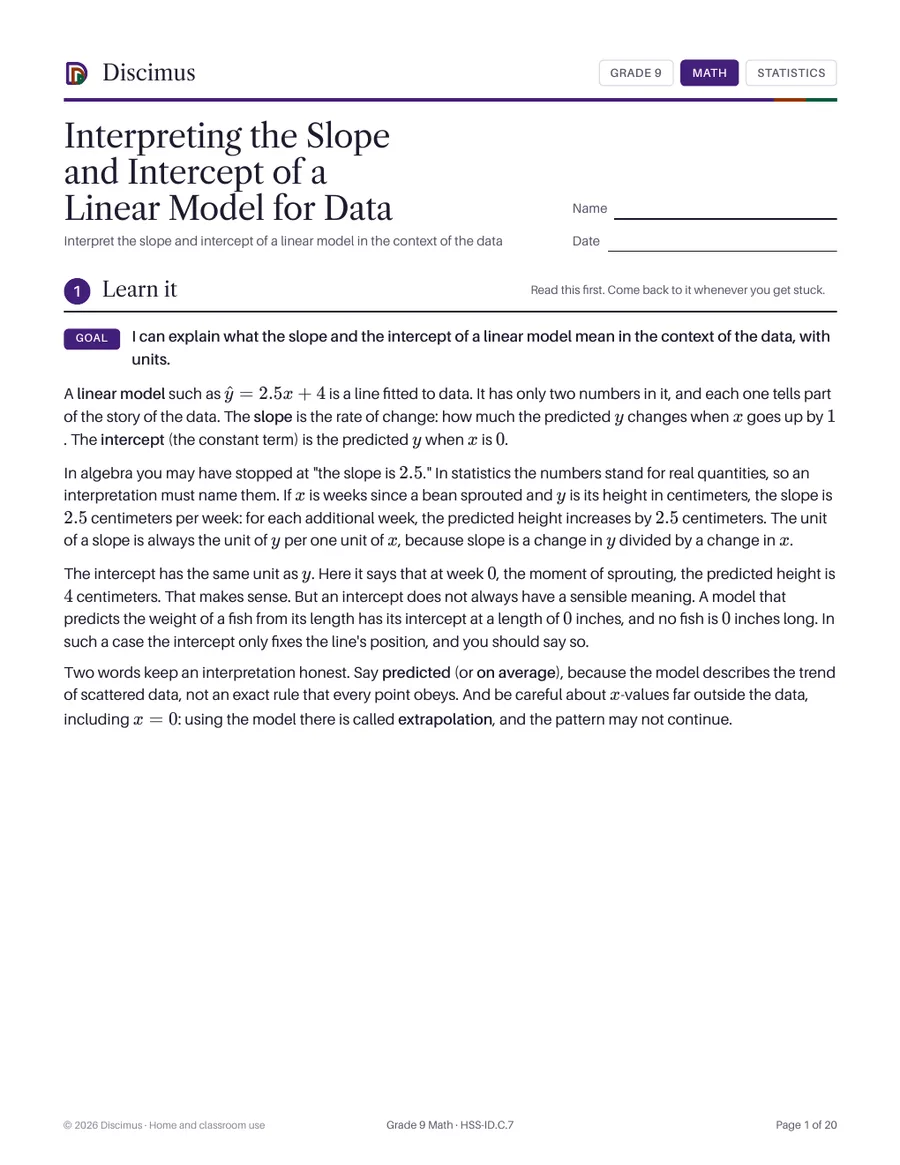
Interpret the slope and intercept of a linear model in the context of the data
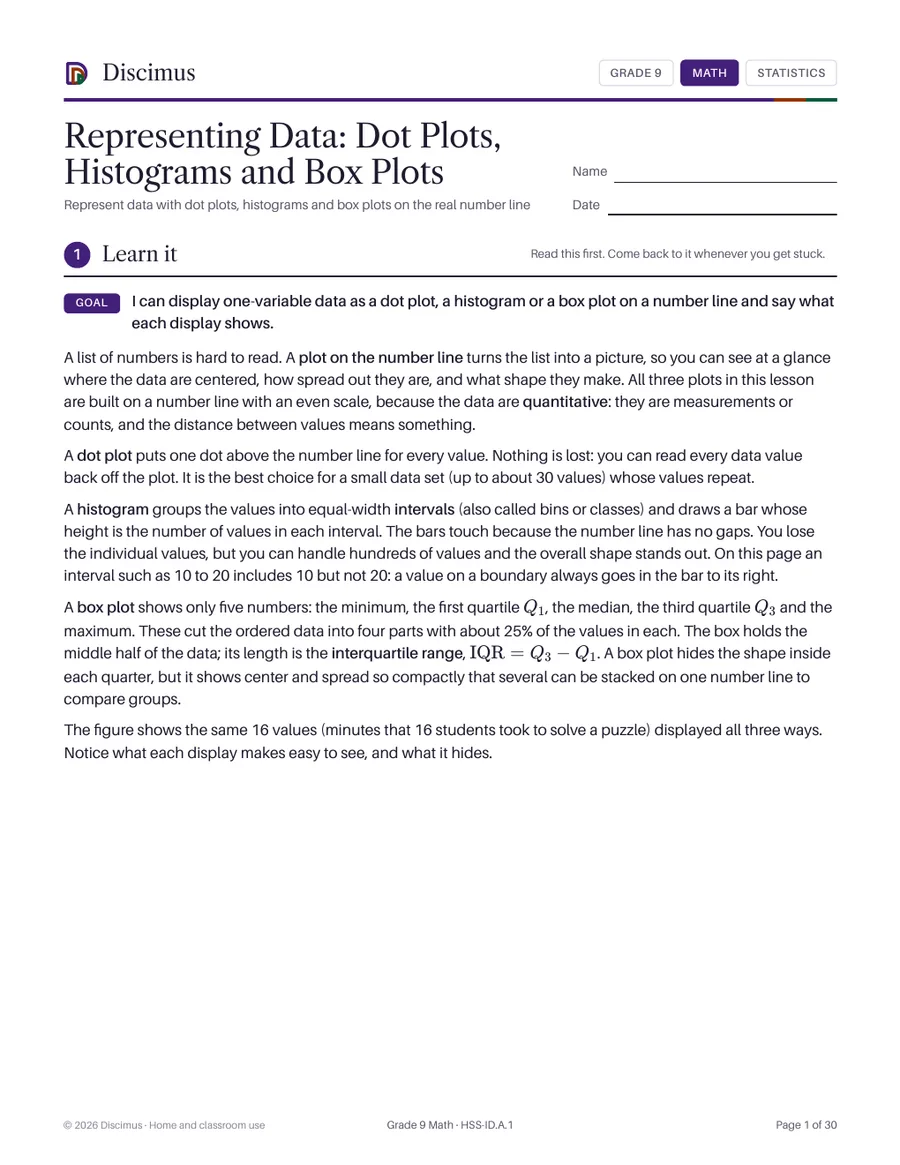
Represent data with dot plots, histograms and box plots on the real number line
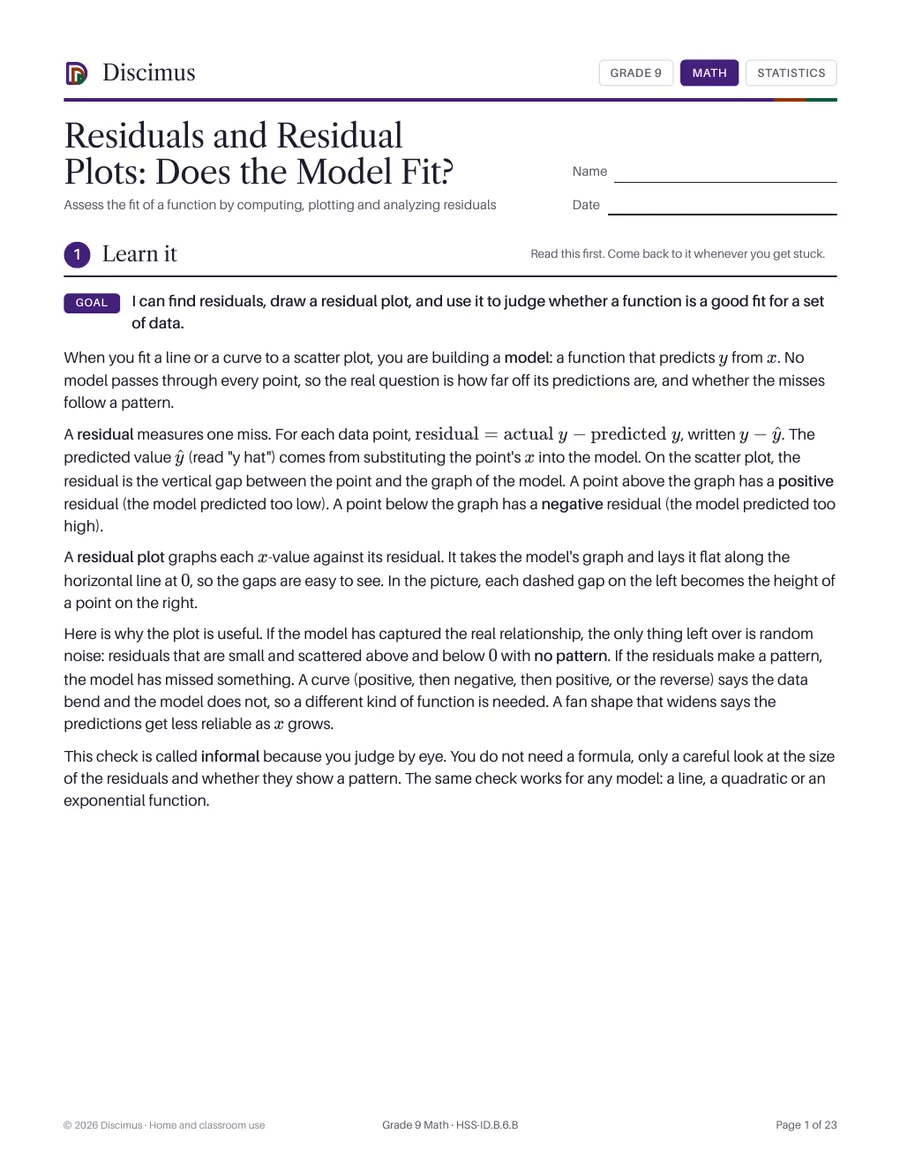
Assess the fit of a function by computing, plotting and analyzing residuals
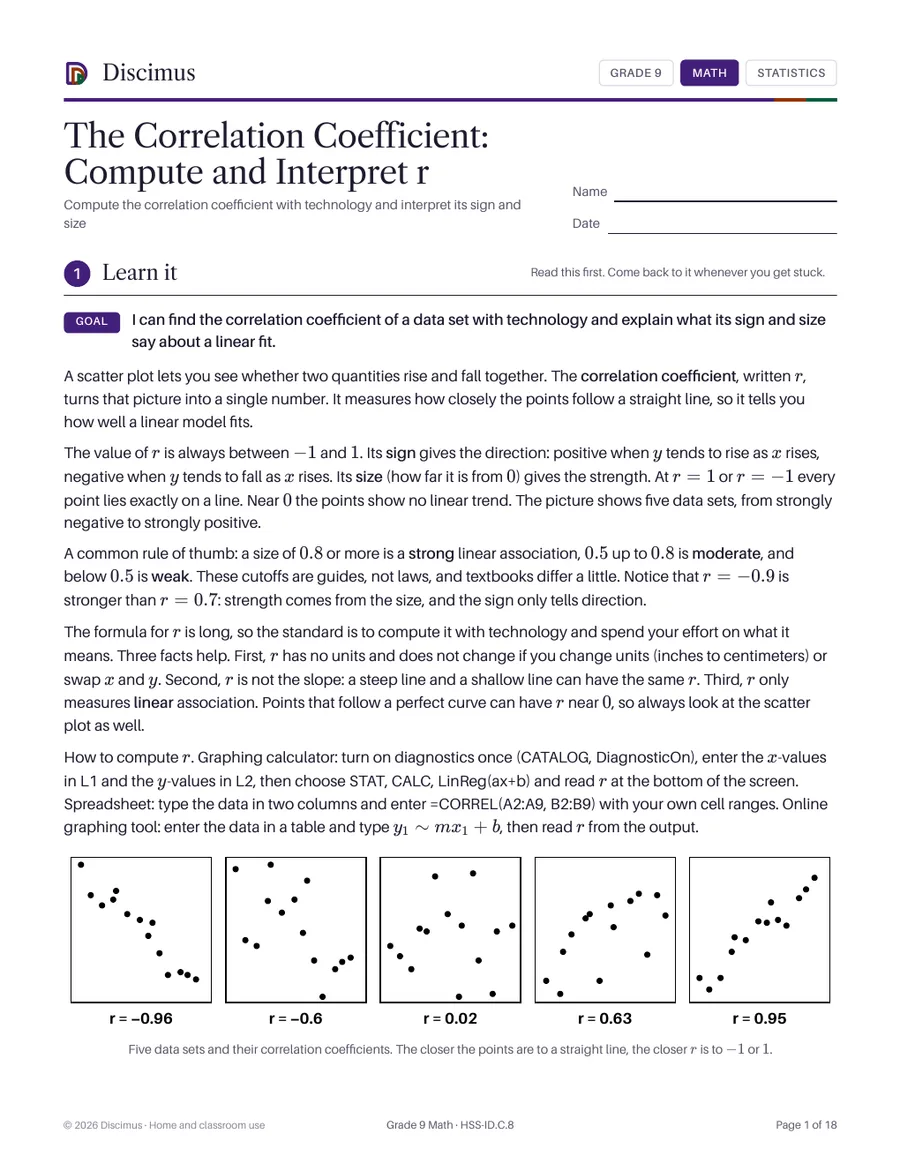
Compute the correlation coefficient with technology and interpret its sign and size
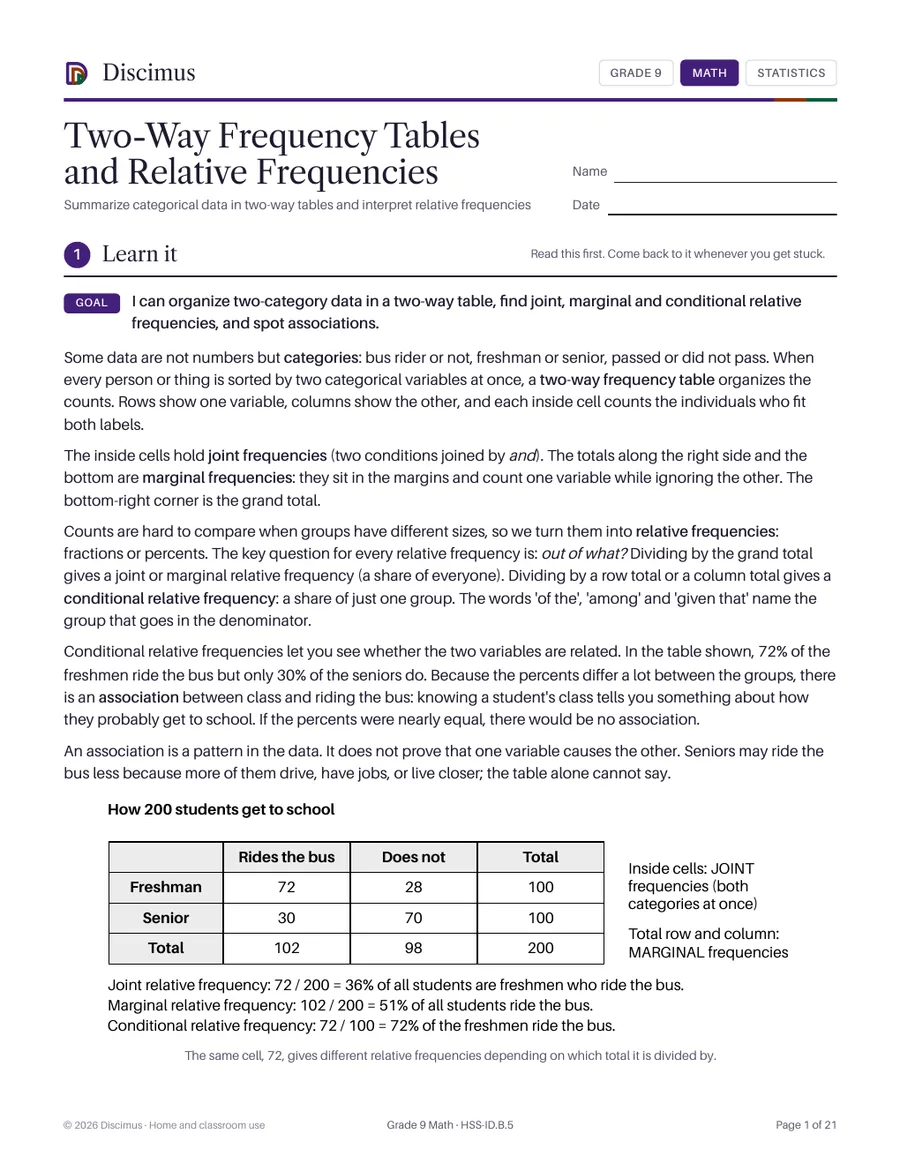
Summarize categorical data in two-way tables and interpret relative frequencies