Average Rate of Change Over an Interval
Calculate, estimate and interpret average rate of change over an interval
Common Core State Standards for Mathematics
From counting to calculus, one skill at a time.
Calculate, estimate and interpret average rate of change over an interval
Report measured and calculated quantities to a level of accuracy the measurements support
Compare data sets using center and spread measures that fit the shape of the distribution
Compare properties of two functions given in different representations
Complete the square to solve quadratic equations and derive the quadratic formula
Complete the square in a quadratic expression to reveal its maximum or minimum value
Write a linear or exponential function from a table, graph, description or two points
Distinguish between correlation and causation and evaluate causal claims
Write equations in two or more variables and graph them with labeled, scaled axes
Write and solve equations and inequalities in one variable that model situations
Choose and define an appropriate quantity, with units, to describe a real situation
Relate the domain of a function to its graph and to the situation it models
Compare exponential growth with linear and polynomial growth using tables and graphs
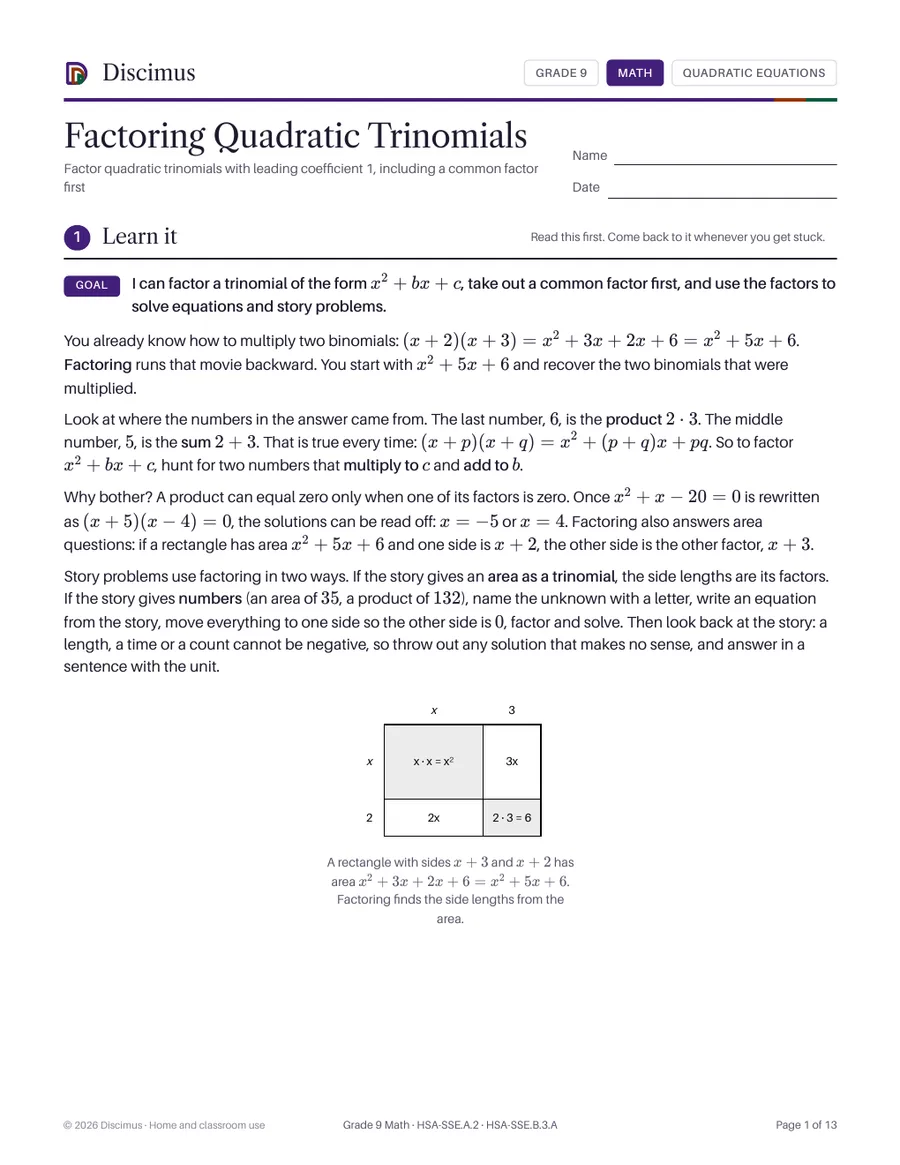
Factor quadratic trinomials with leading coefficient 1, including a common factor first
Fit a linear function to a scatter plot by eye and with technology, and write its equation
Fit linear, quadratic and exponential functions to data and use them to solve problems
Evaluate functions in function notation and interpret statements like f(a) = b in context
Graph exponential, logarithmic and trigonometric functions and show their key features
Graph linear and quadratic functions showing intercepts, maxima and minima
Graph linear inequalities as half-planes and systems as the overlap of half-planes
Graph polynomial functions using factored zeros and end behavior
Graph rational functions, identifying zeros, asymptotes and end behavior
Graph square root, cube root, absolute value, piecewise and step functions
Use exponent properties to find the percent rate of change of an exponential function
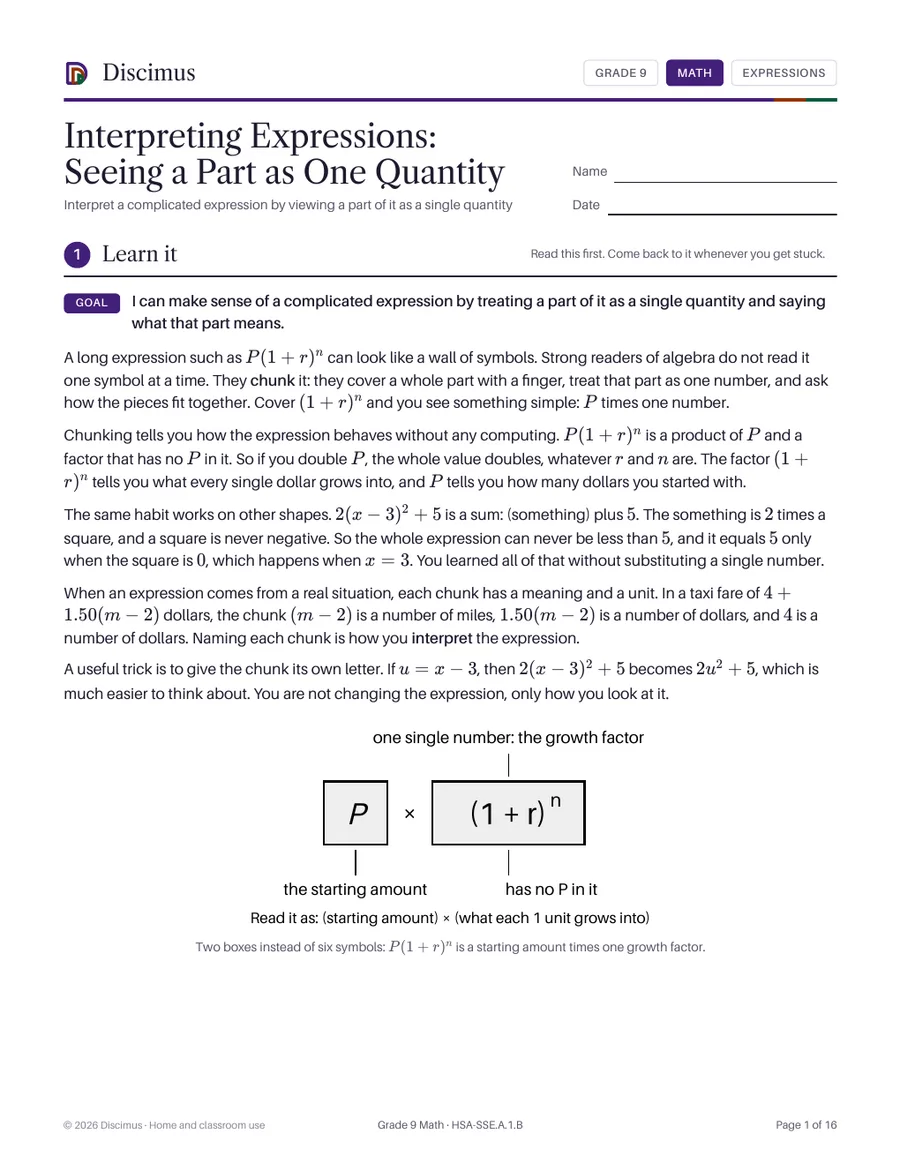
Interpret a complicated expression by viewing a part of it as a single quantity
Interpret key features of graphs and tables and sketch graphs from descriptions
Interpret the parameters of a linear or exponential function in terms of its context
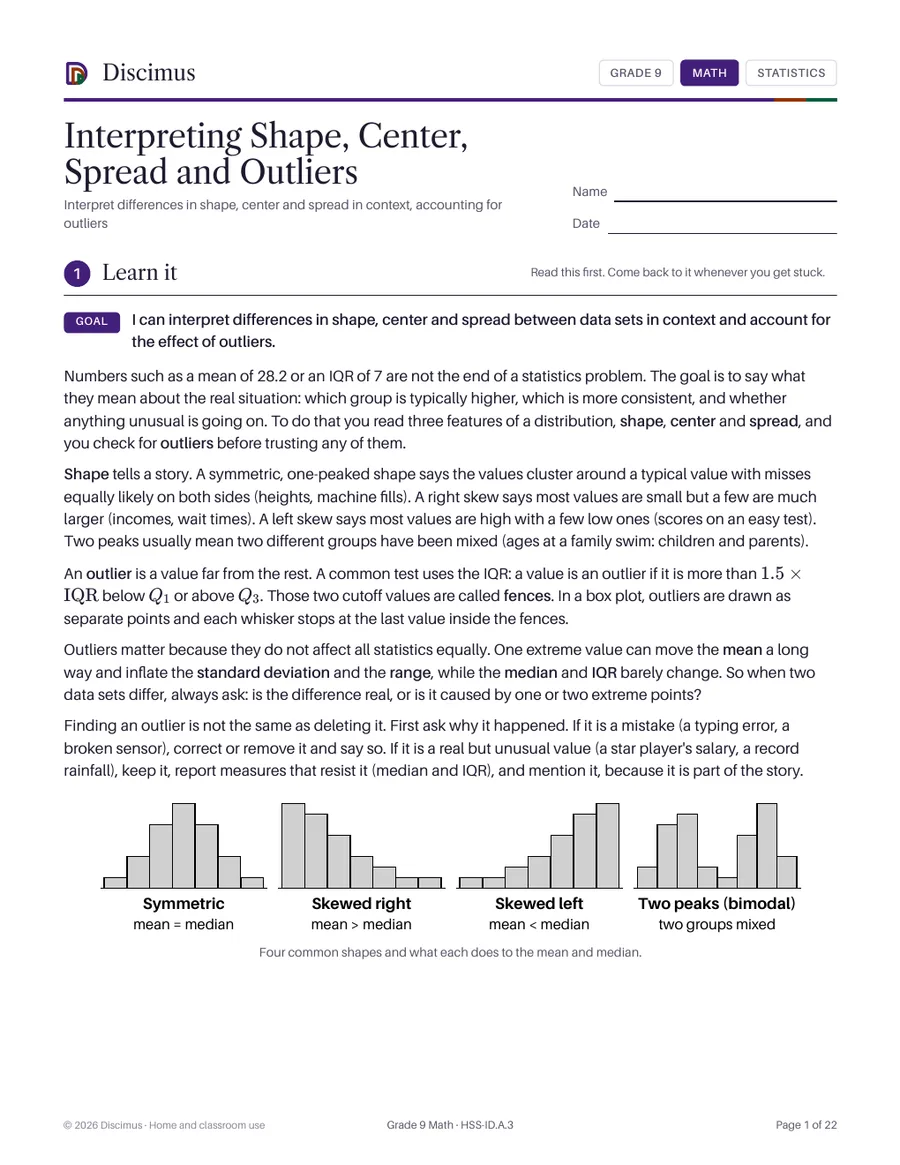
Interpret differences in shape, center and spread in context, accounting for outliers
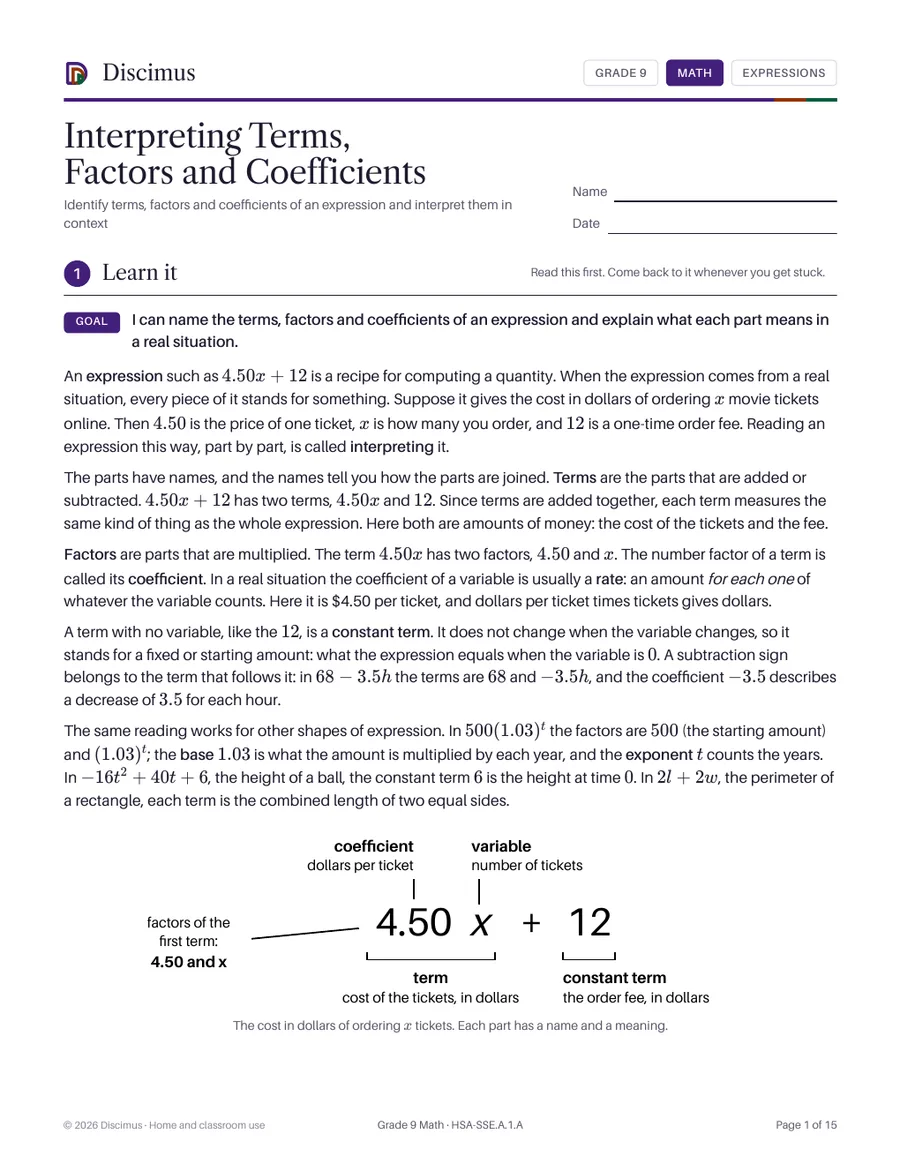
Identify terms, factors and coefficients of an expression and interpret them in context
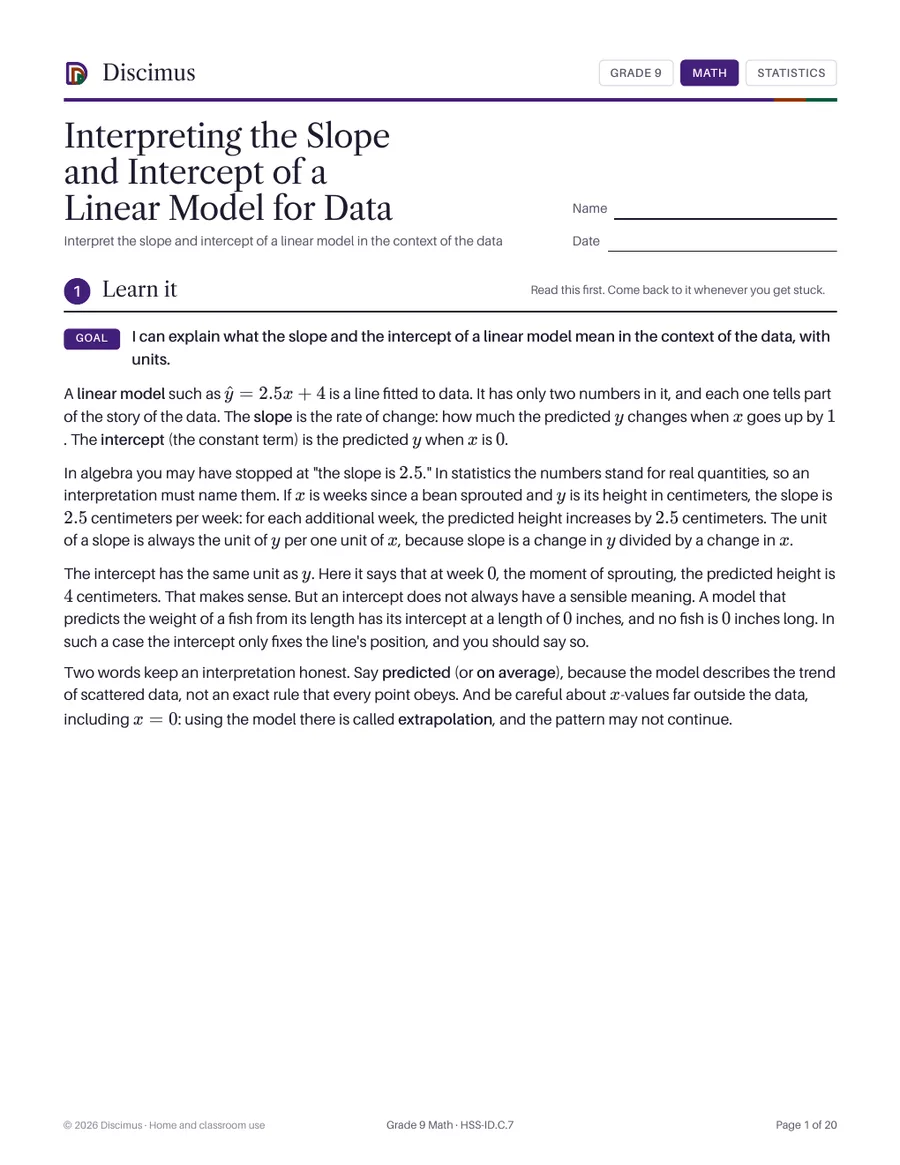
Interpret the slope and intercept of a linear model in the context of the data
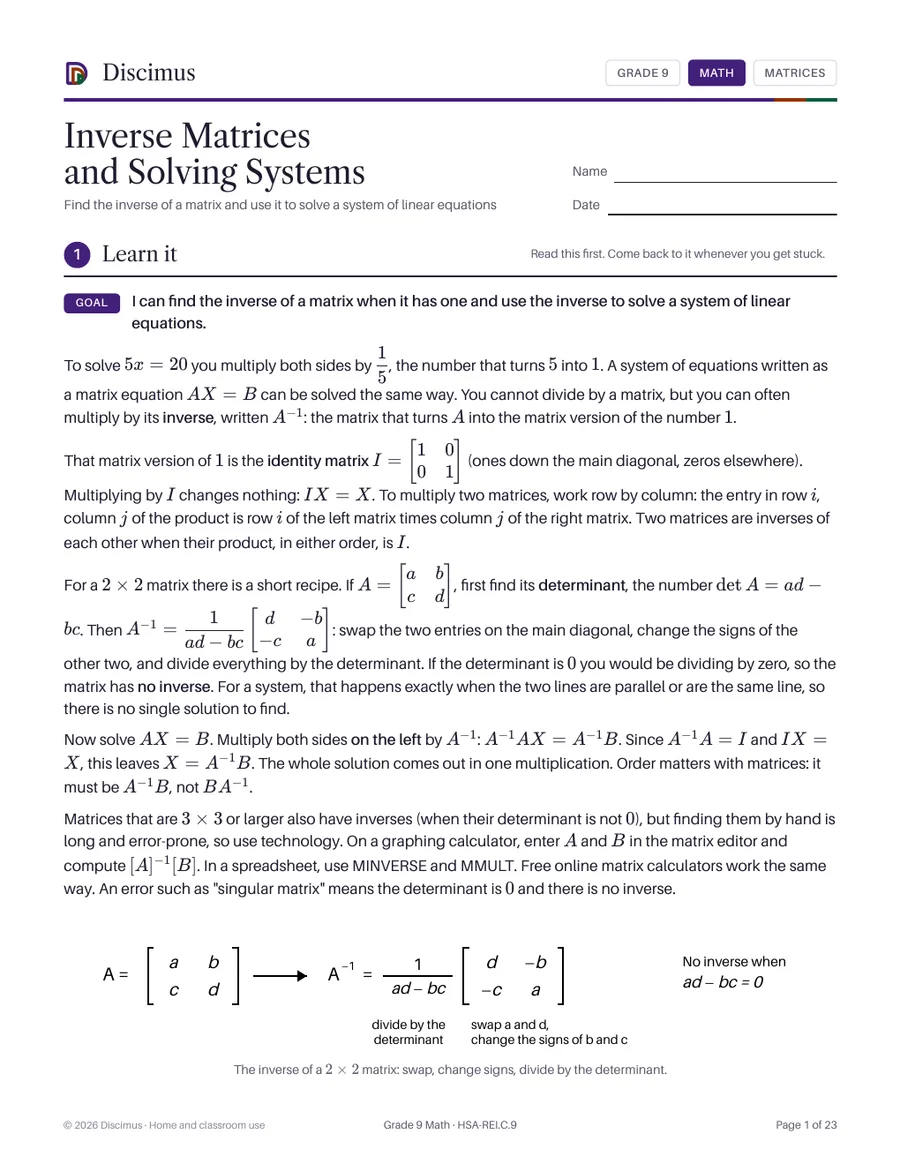
Find the inverse of a matrix and use it to solve a system of linear equations
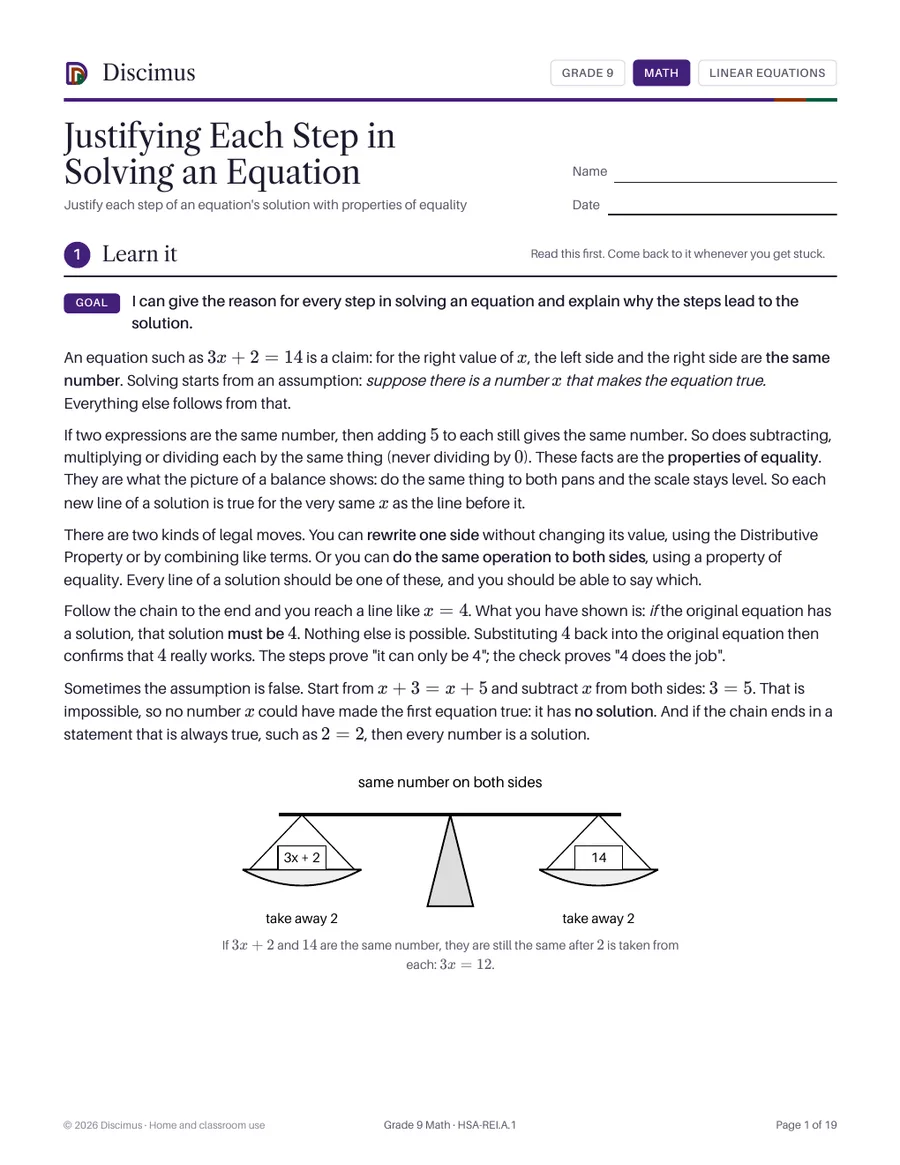
Justify each step of an equation's solution with properties of equality
Solve linear equations and inequalities in one variable, including letter coefficients
Prove linear functions grow by equal differences, exponential ones by equal factors
Solve simple rational and radical equations and identify extraneous solutions
Rearrange a formula to solve for a chosen variable
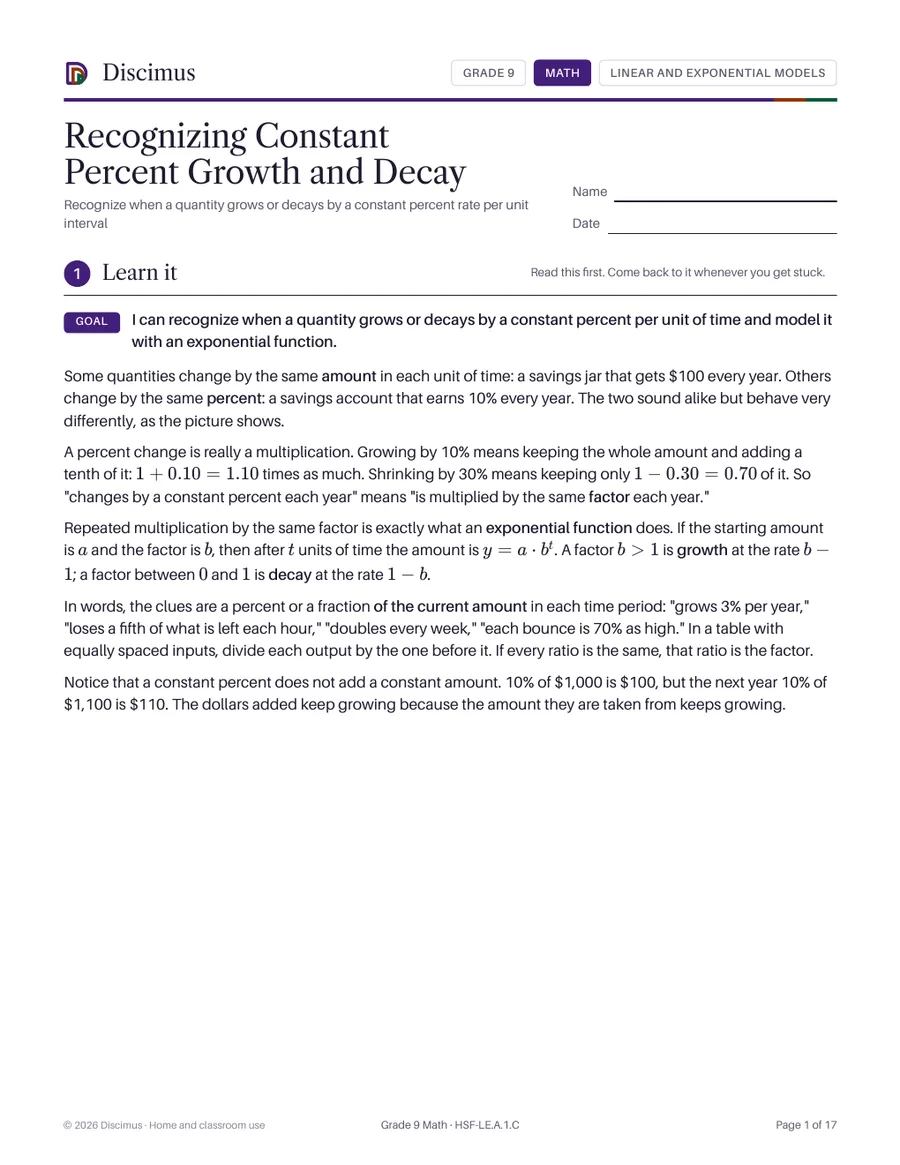
Recognize when a quantity grows or decays by a constant percent rate per unit interval
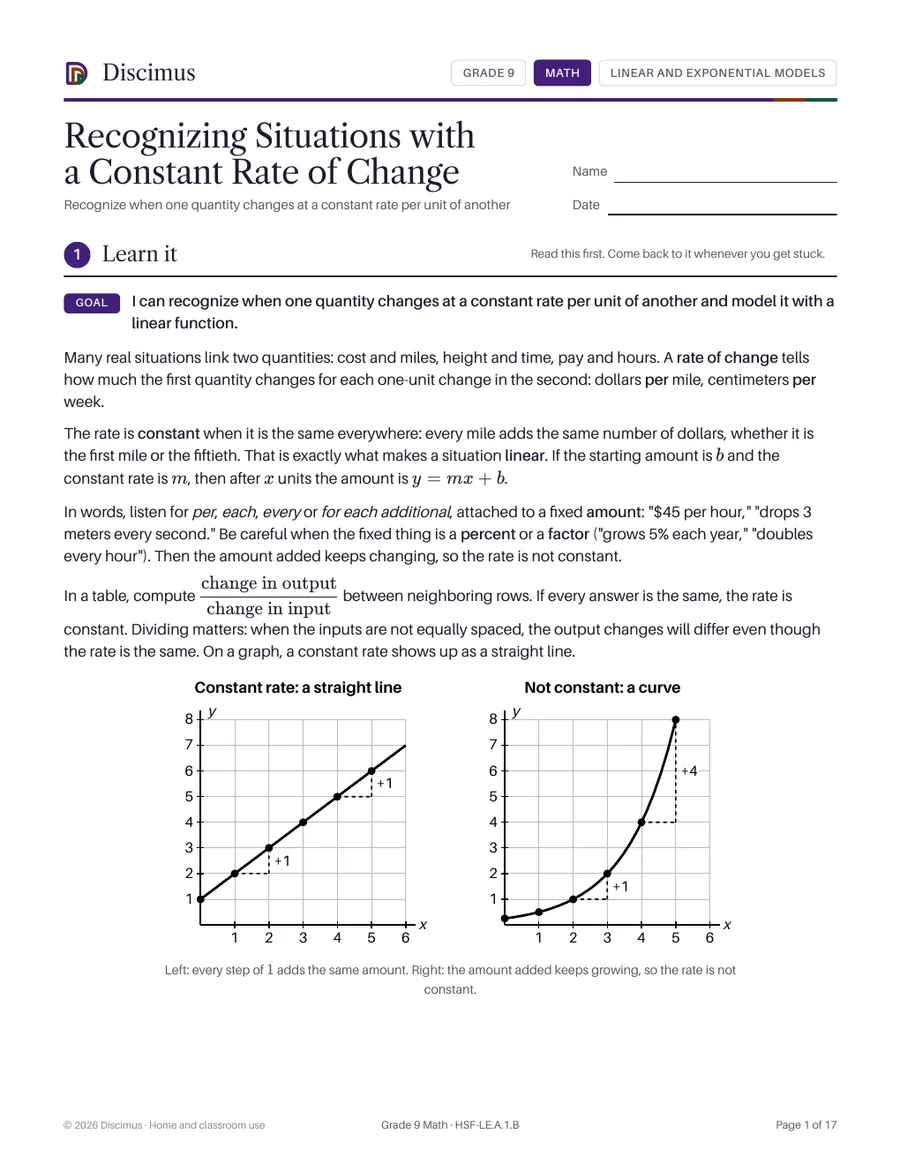
Recognize when one quantity changes at a constant rate per unit of another
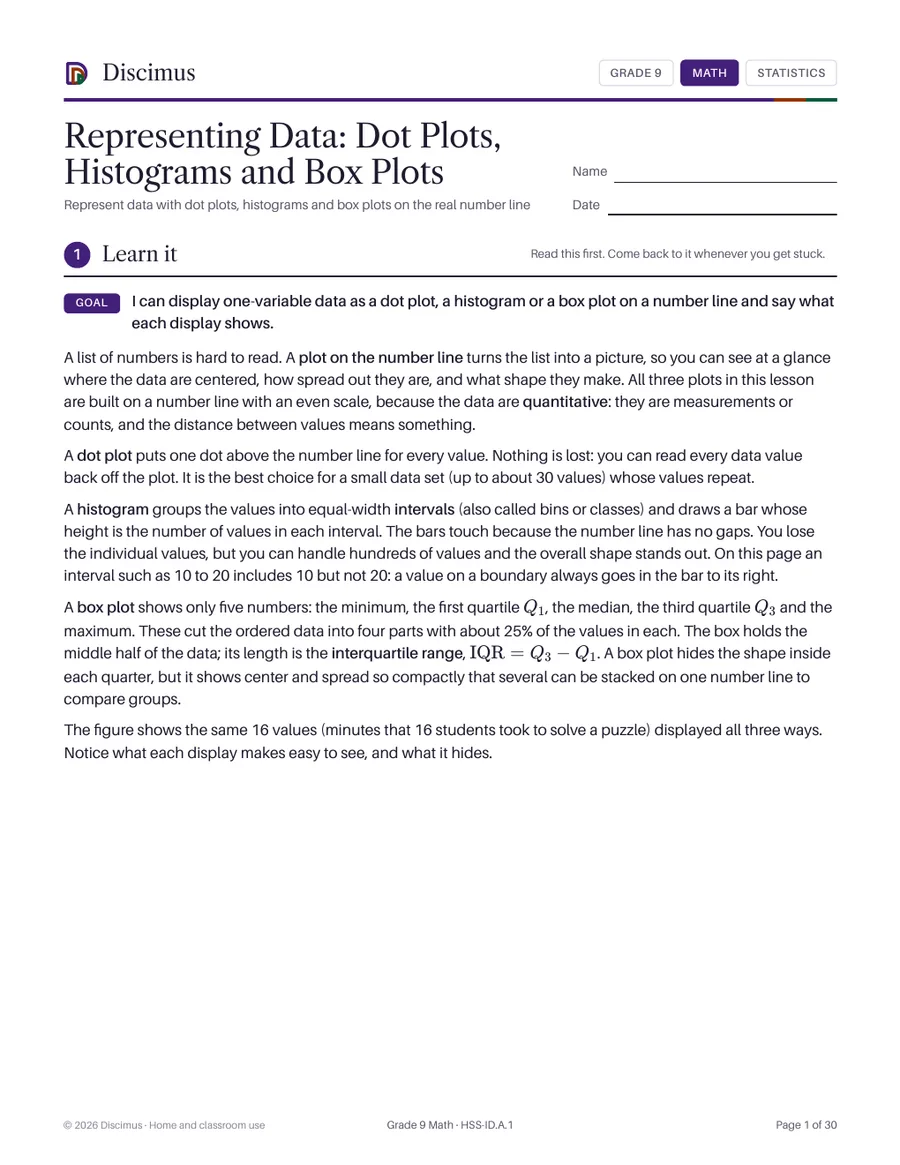
Represent data with dot plots, histograms and box plots on the real number line
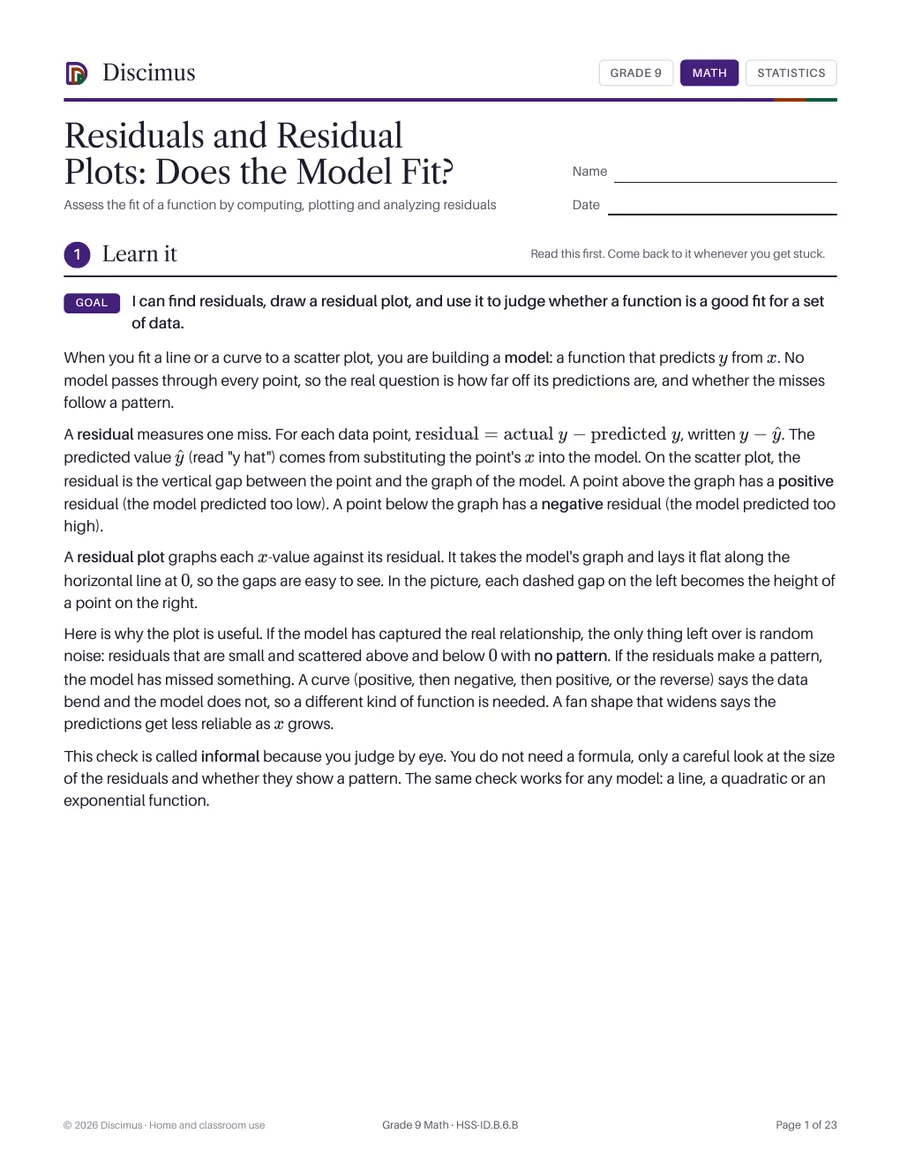
Assess the fit of a function by computing, plotting and analyzing residuals
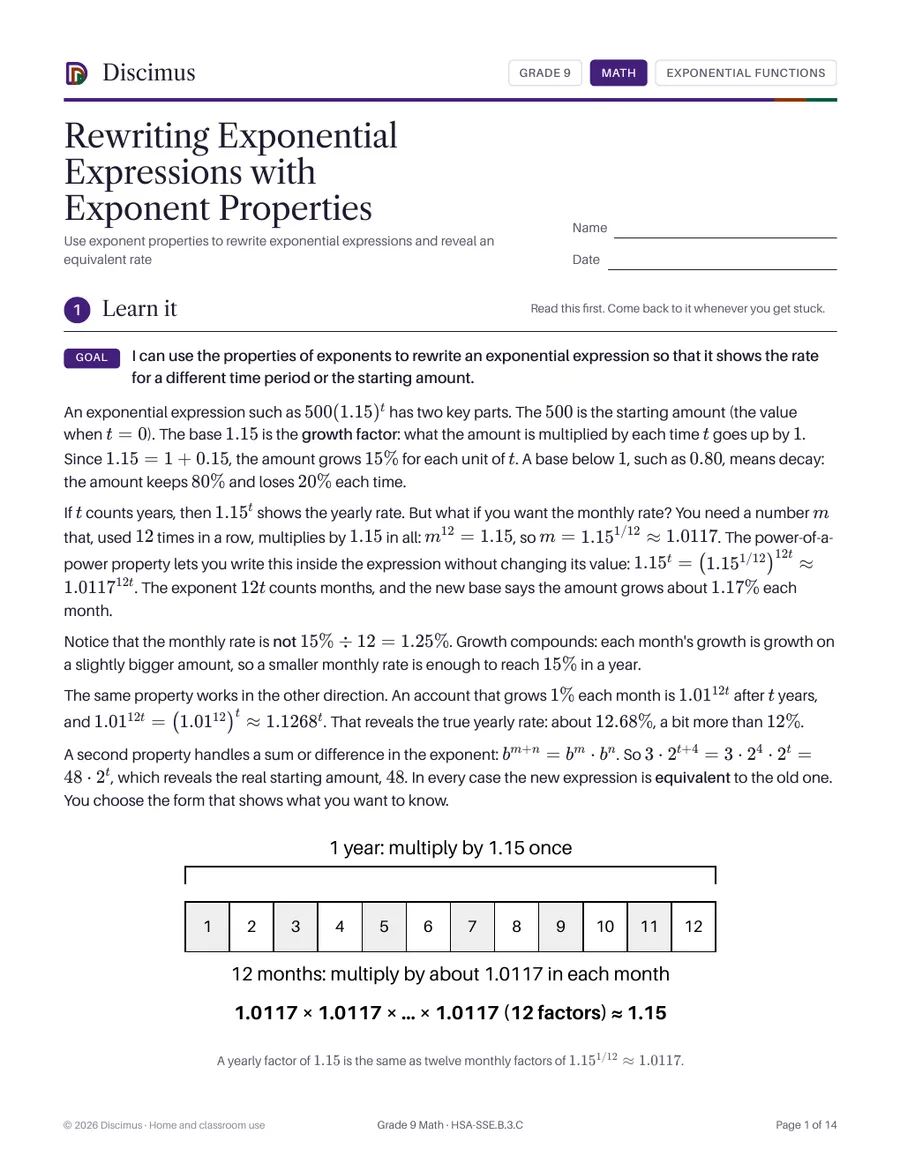
Use exponent properties to rewrite exponential expressions and reveal an equivalent rate
Factor and complete the square to show a quadratic's zeros, extreme value and symmetry
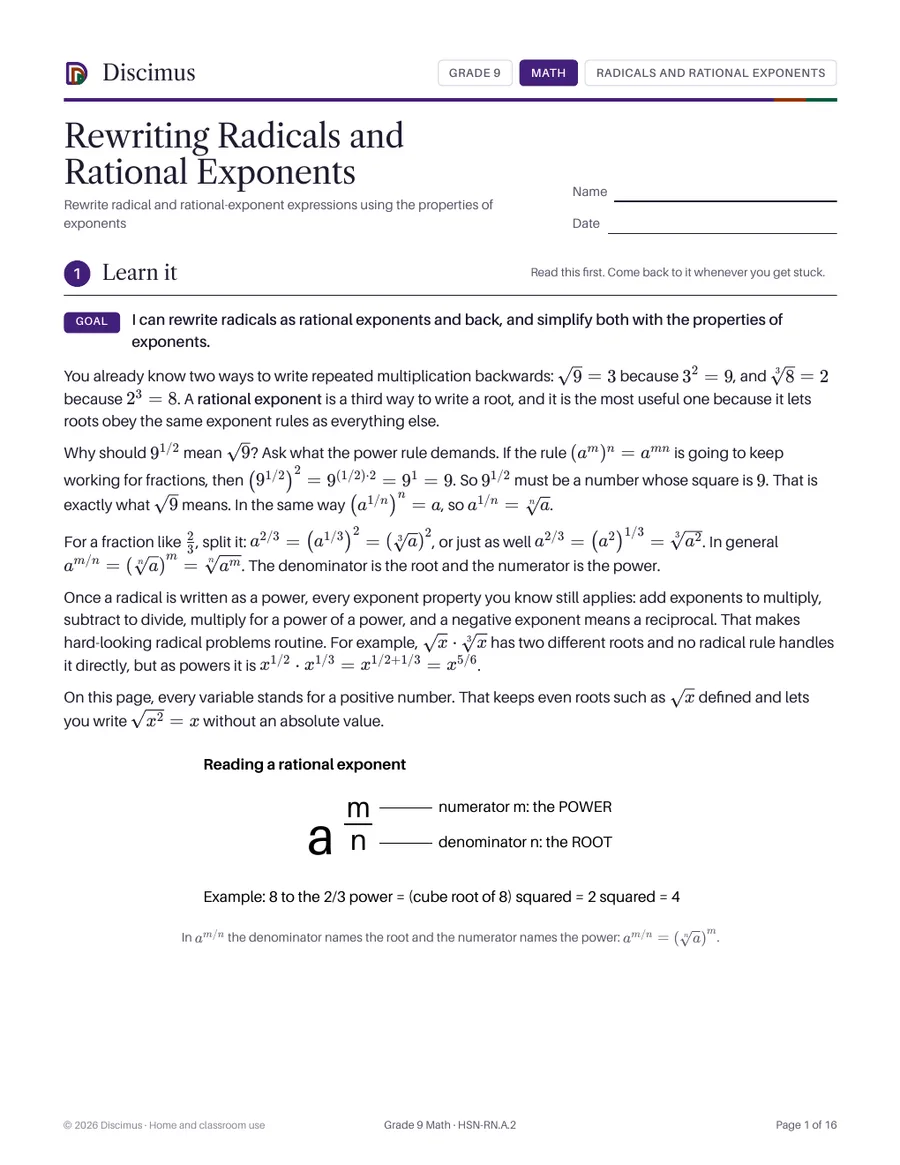
Rewrite radical and rational-exponent expressions using the properties of exponents
Treat sequences as functions on the integers and use explicit and recursive rules
Solve f(x) = g(x) from intersecting graphs, tables and successive approximation
Solve a system of one linear and one quadratic equation algebraically and graphically
Explain why sums and products of rationals and irrationals are rational or irrational
Solve systems of two linear equations by substitution and by elimination
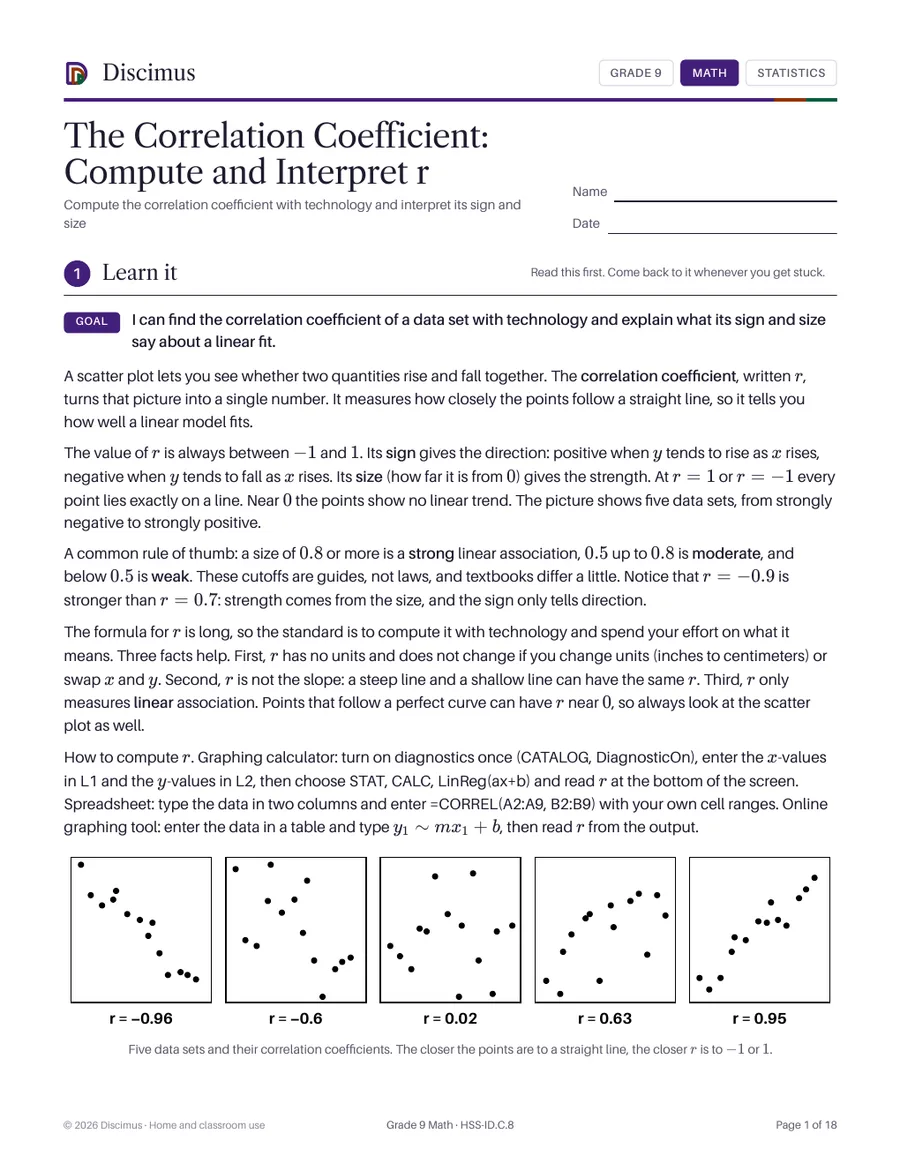
Compute the correlation coefficient with technology and interpret its sign and size
Explain and use the fact that a graph shows every solution of an equation in two variables
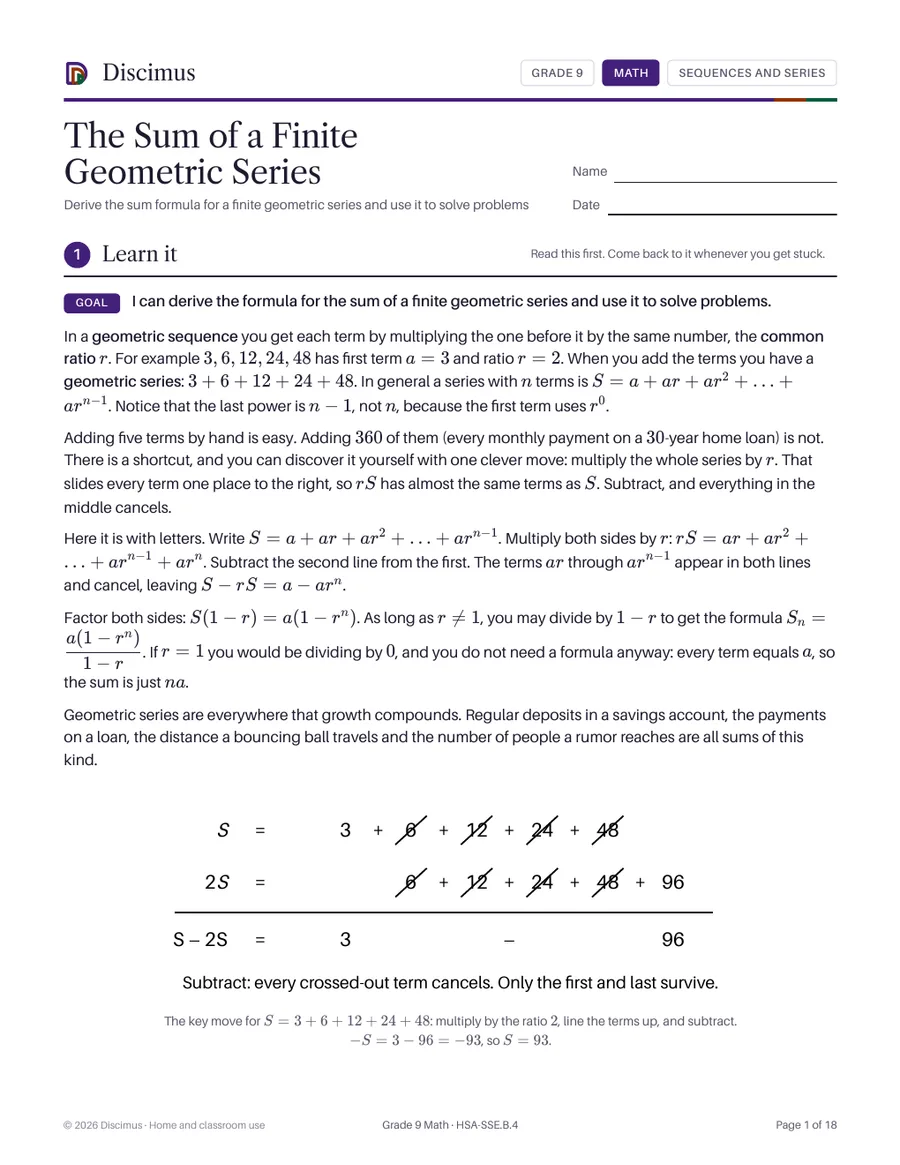
Derive the sum formula for a finite geometric series and use it to solve problems
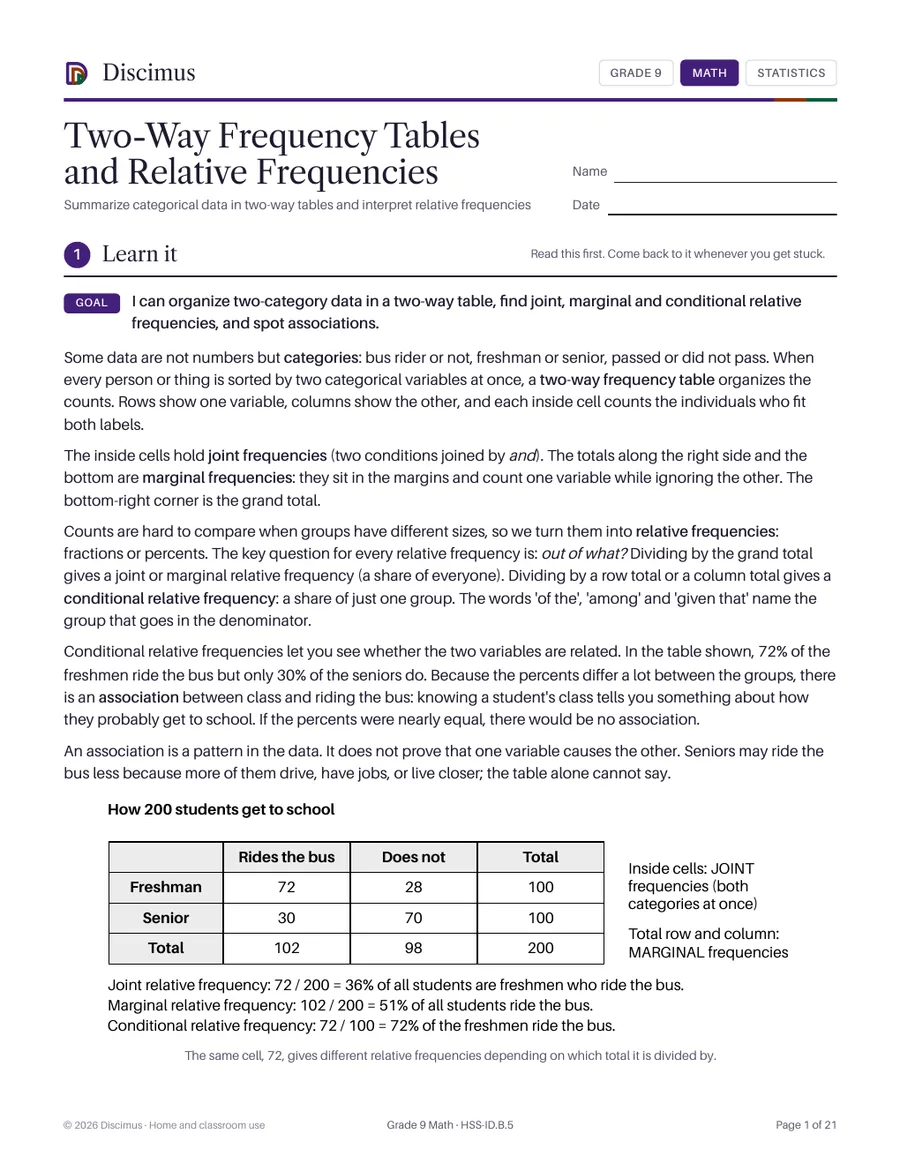
Summarize categorical data in two-way tables and interpret relative frequencies
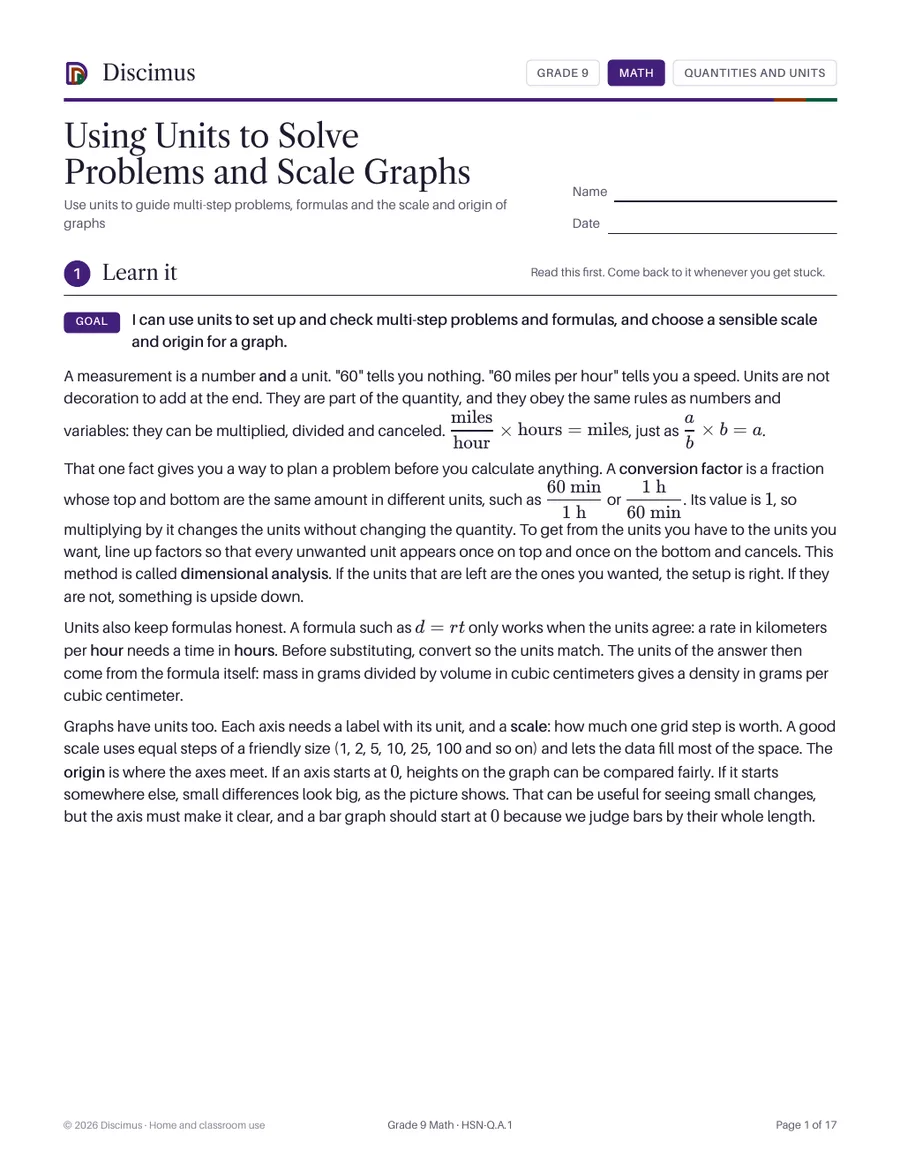
Use units to guide multi-step problems, formulas and the scale and origin of graphs
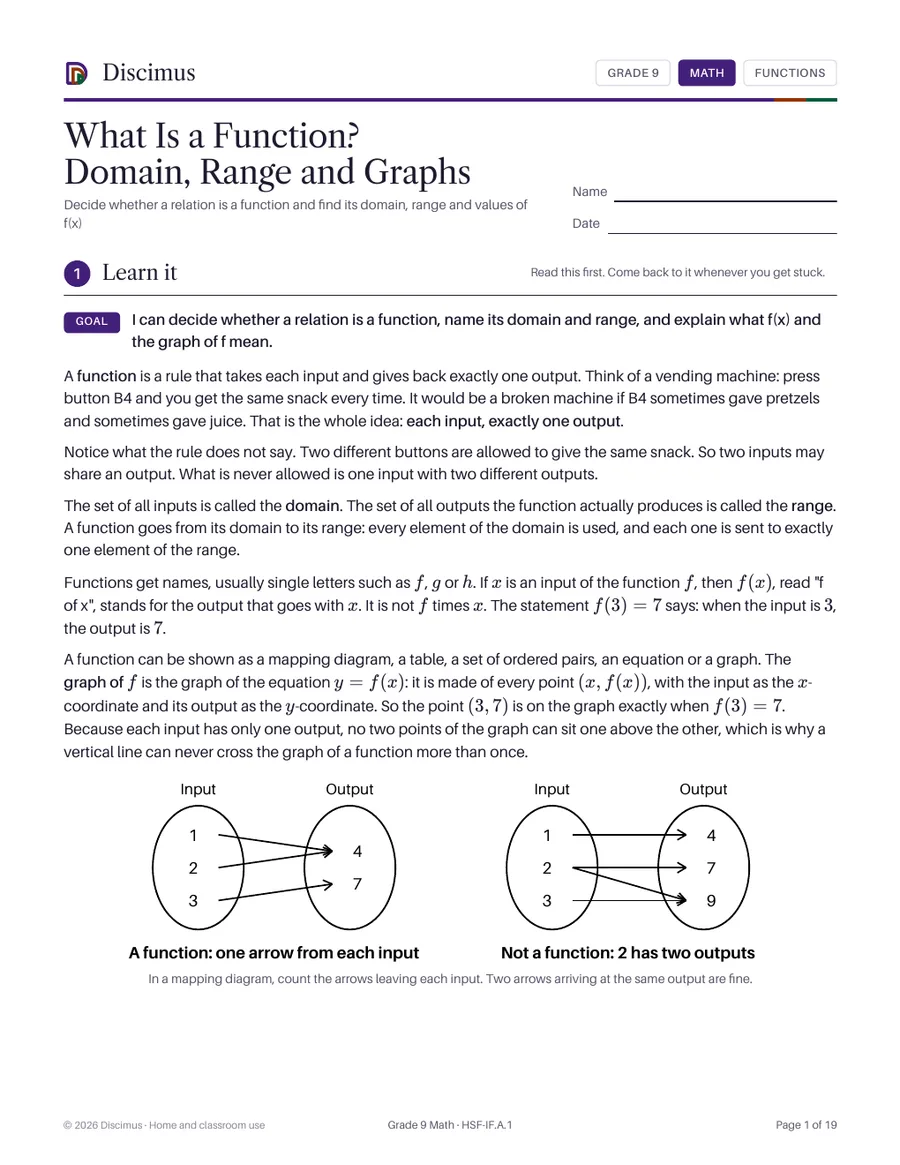
Decide whether a relation is a function and find its domain, range and values of f(x)
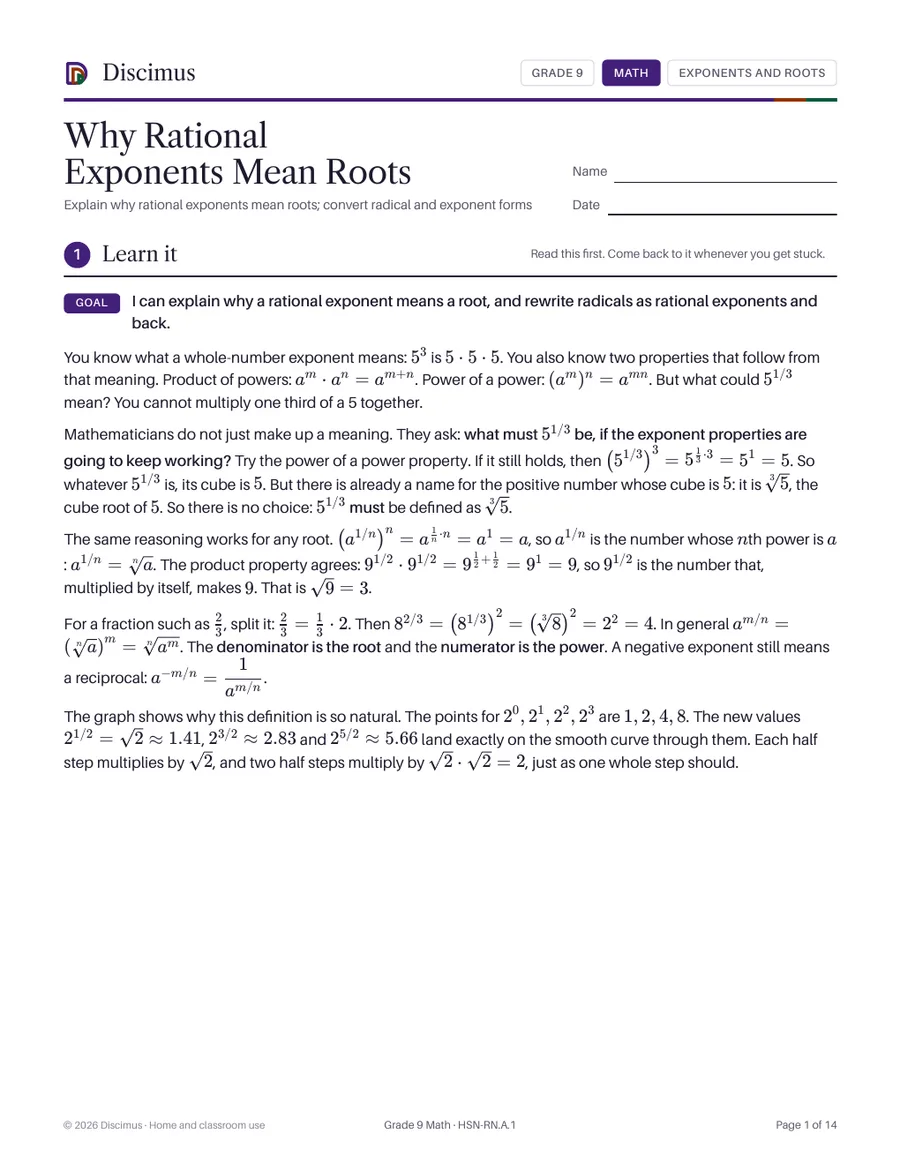
Explain why rational exponents mean roots; convert radical and exponent forms
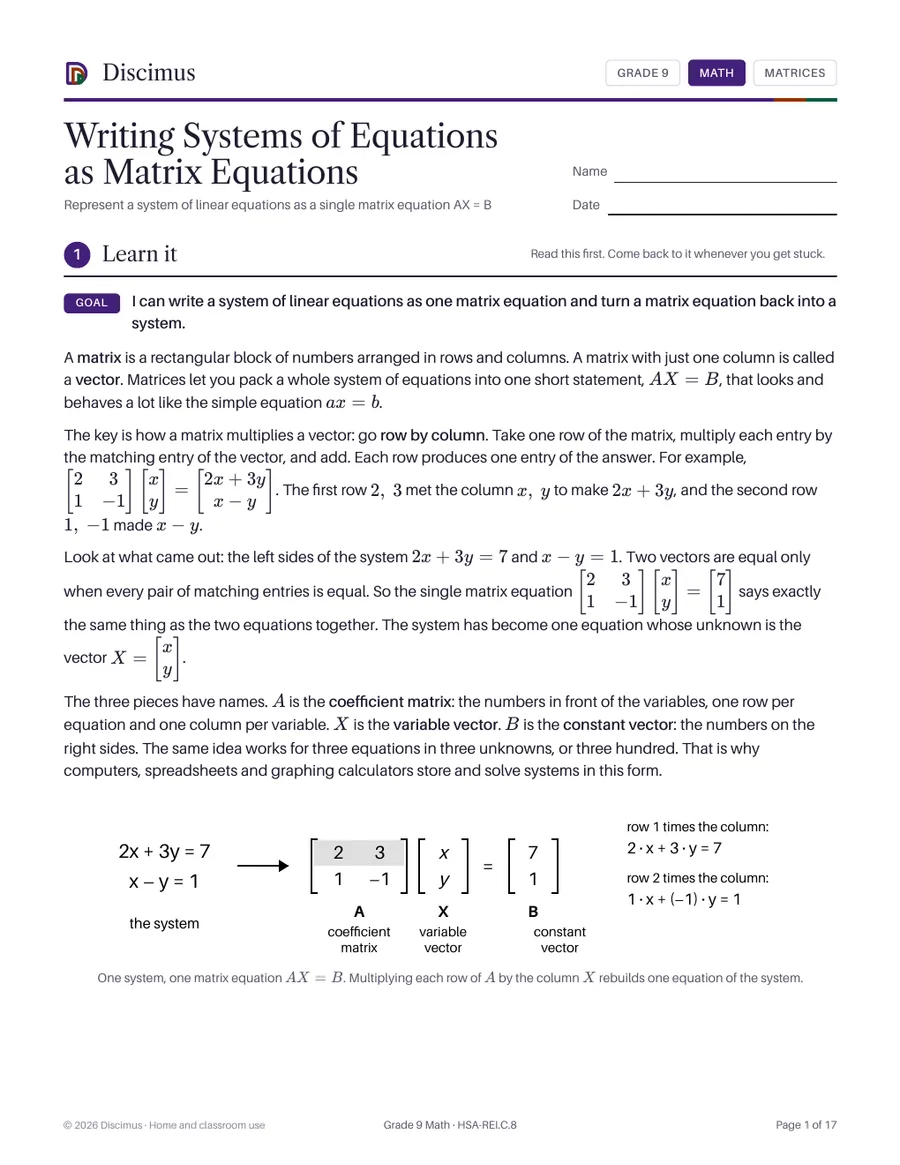
Represent a system of linear equations as a single matrix equation AX = B