Average Rate of Change Over an Interval
Calculate, estimate and interpret average rate of change over an interval
A full lesson on graphing a linear inequality as a half-plane with a solid or dashed boundary and a system of inequalities as the overlap of half-planes, with 34 practice problems and 10 story problems.
For members. Join for $119.88 a year to download every Grade 9 worksheet.
Graph the solutions of a linear inequality in two variables as a half-plane, leaving out the boundary for a strict inequality, and graph a system of linear inequalities as the intersection of the half-planes.
Calculate, estimate and interpret average rate of change over an interval
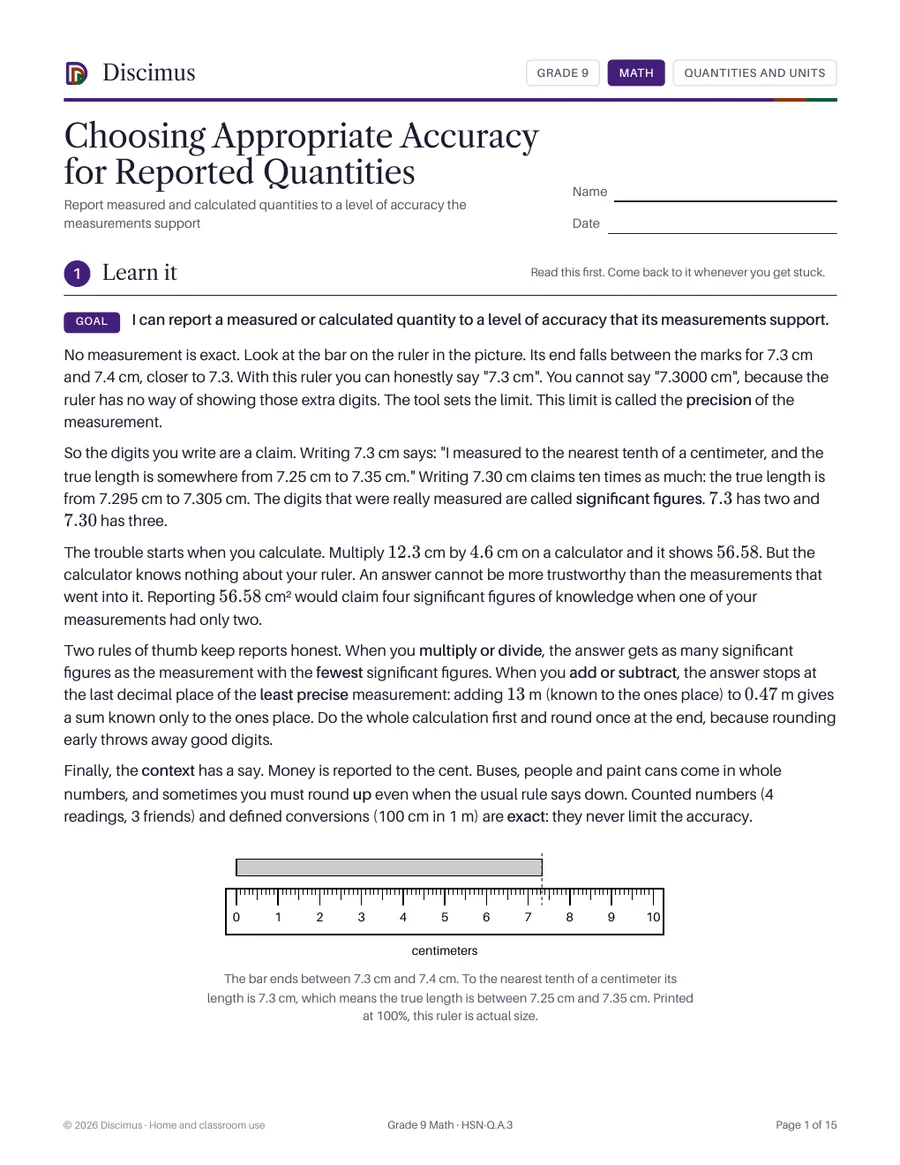
Report measured and calculated quantities to a level of accuracy the measurements support
Compare data sets using center and spread measures that fit the shape of the distribution
Compare properties of two functions given in different representations