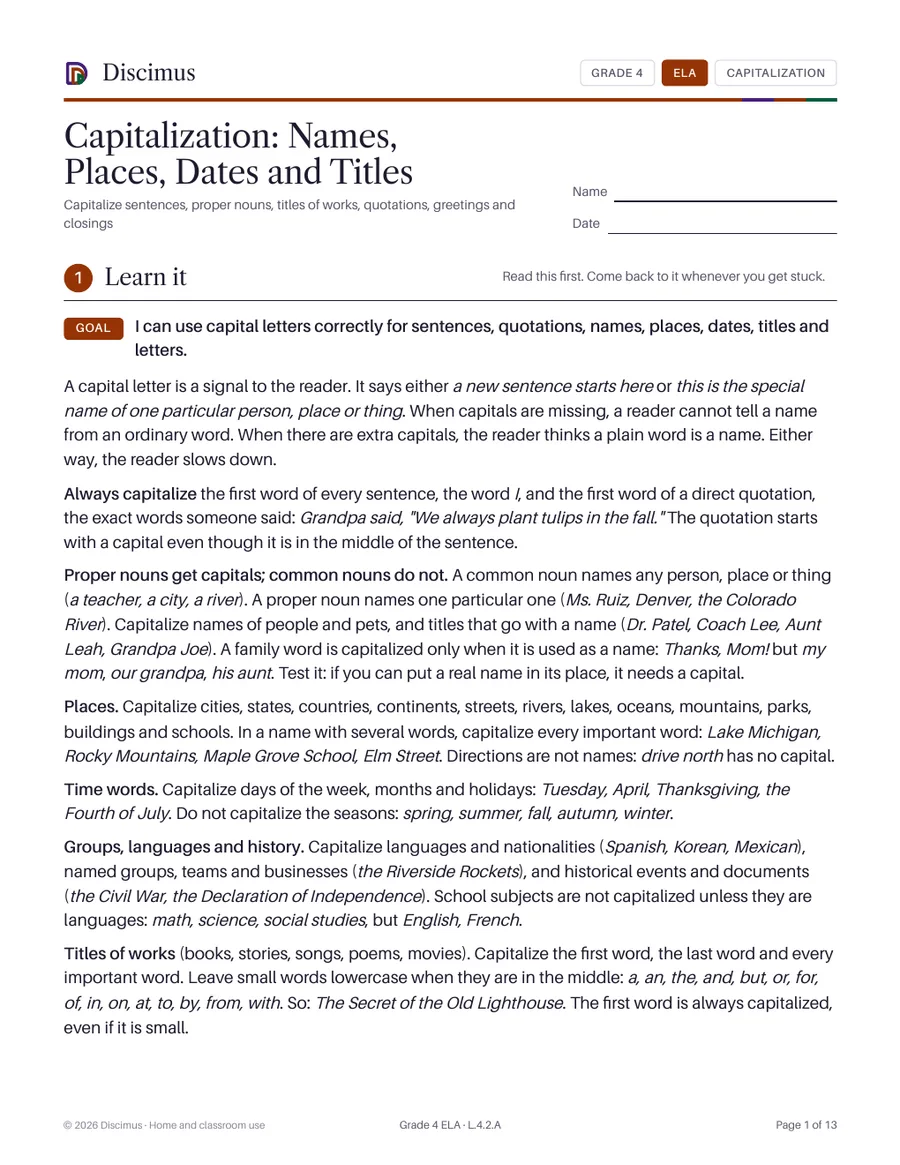
Capitalization: Names, Places, Dates and Titles
Capitalize sentences, proper nouns, titles of works, quotations, greetings and closings
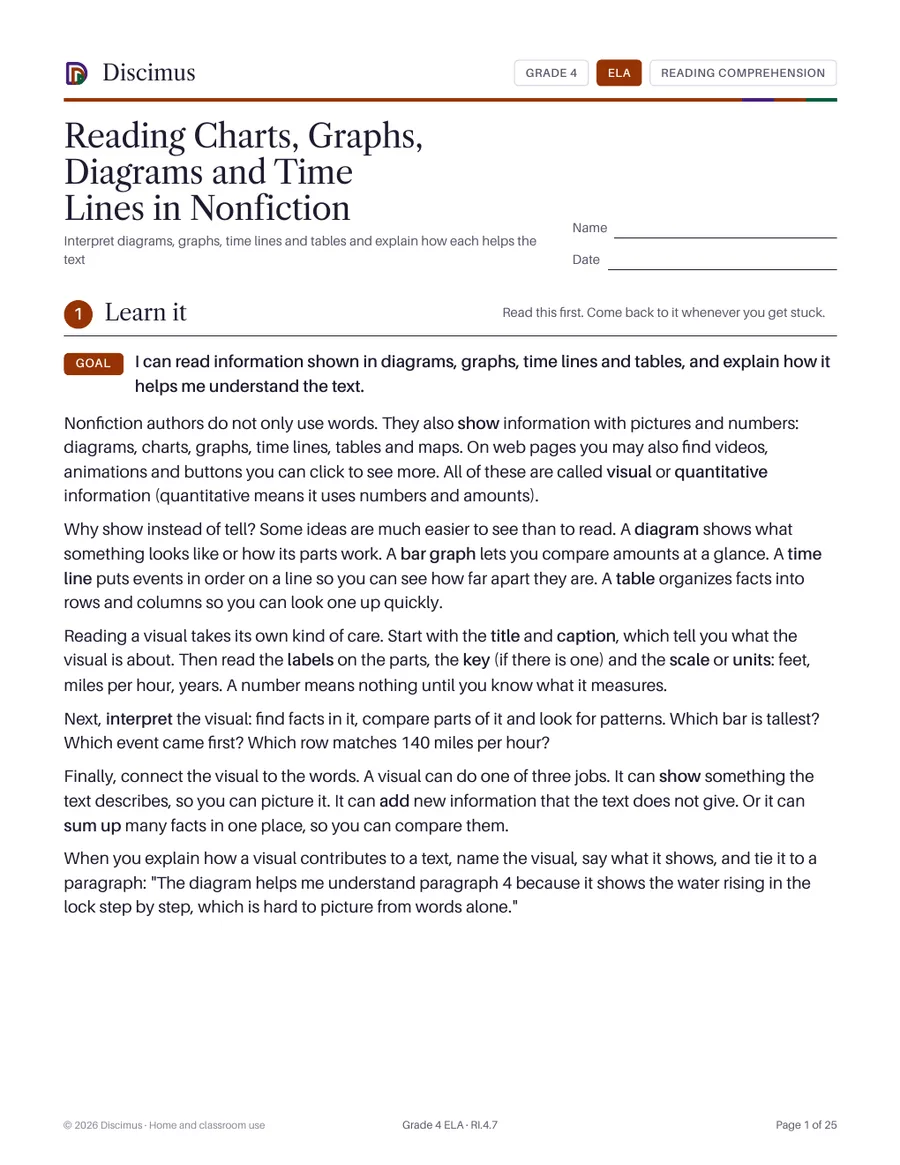
A full lesson on reading diagrams, bar graphs, time lines and tables and explaining what they add to a text, then four true articles (the Panama Canal, the Gateway Arch, the Erie Canal and hurricanes) with 37 questions, a written response and a drawing task.
For members. Join for $119.88 a year to download every Grade 4 worksheet.
Interpret information shown in charts, graphs, diagrams, time lines and similar visuals, and explain how that information helps a reader understand the text it appears in.
Capitalize sentences, proper nouns, titles of works, quotations, greetings and closings
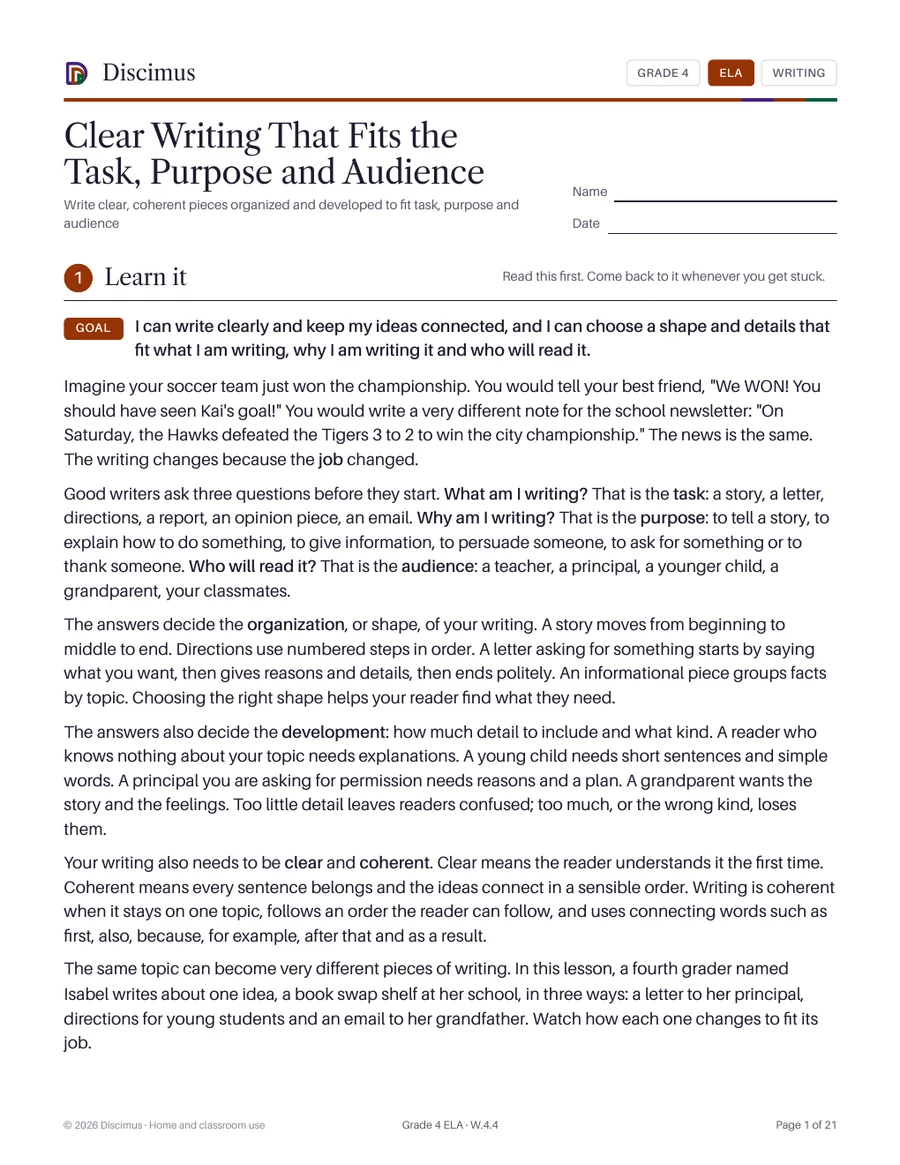
Write clear, coherent pieces organized and developed to fit task, purpose and audience
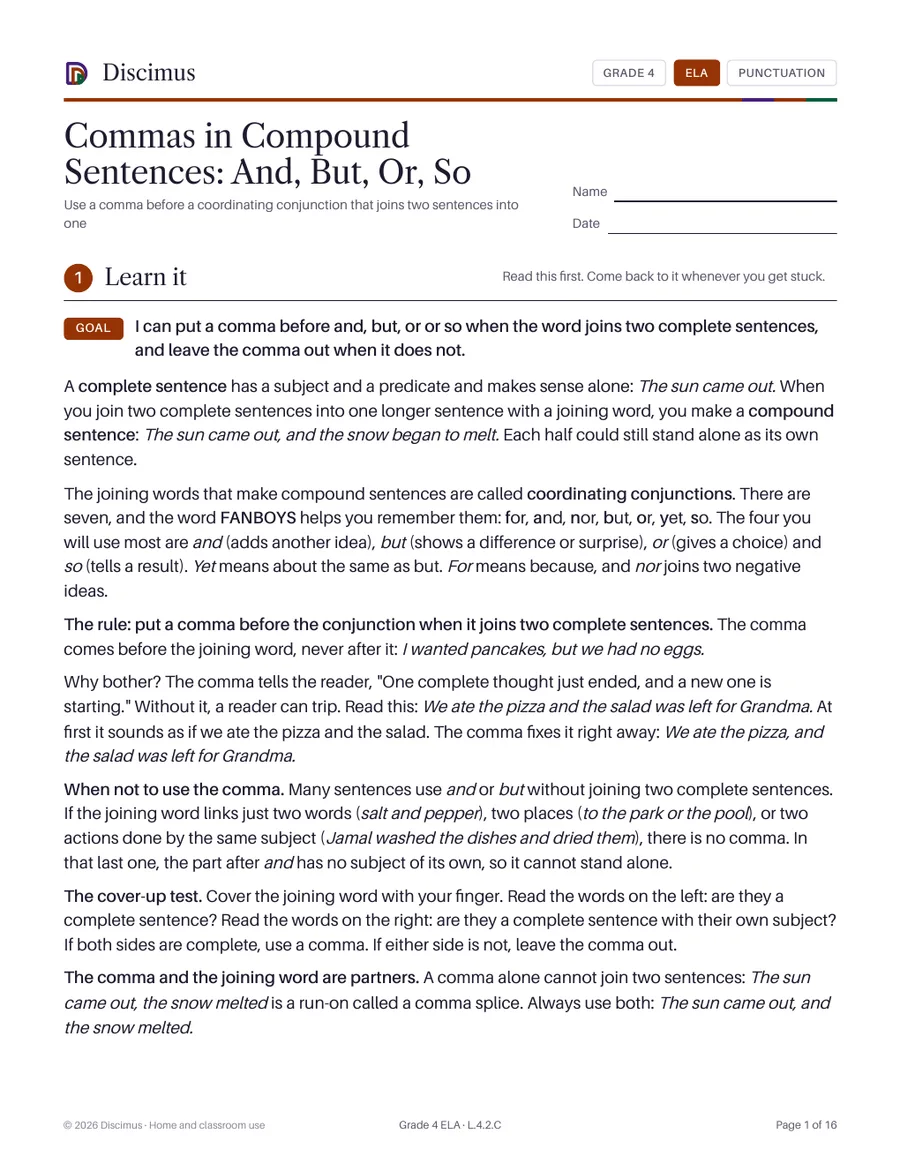
Use a comma before a coordinating conjunction that joins two sentences into one
Write complete sentences and correct fragments and run-ons