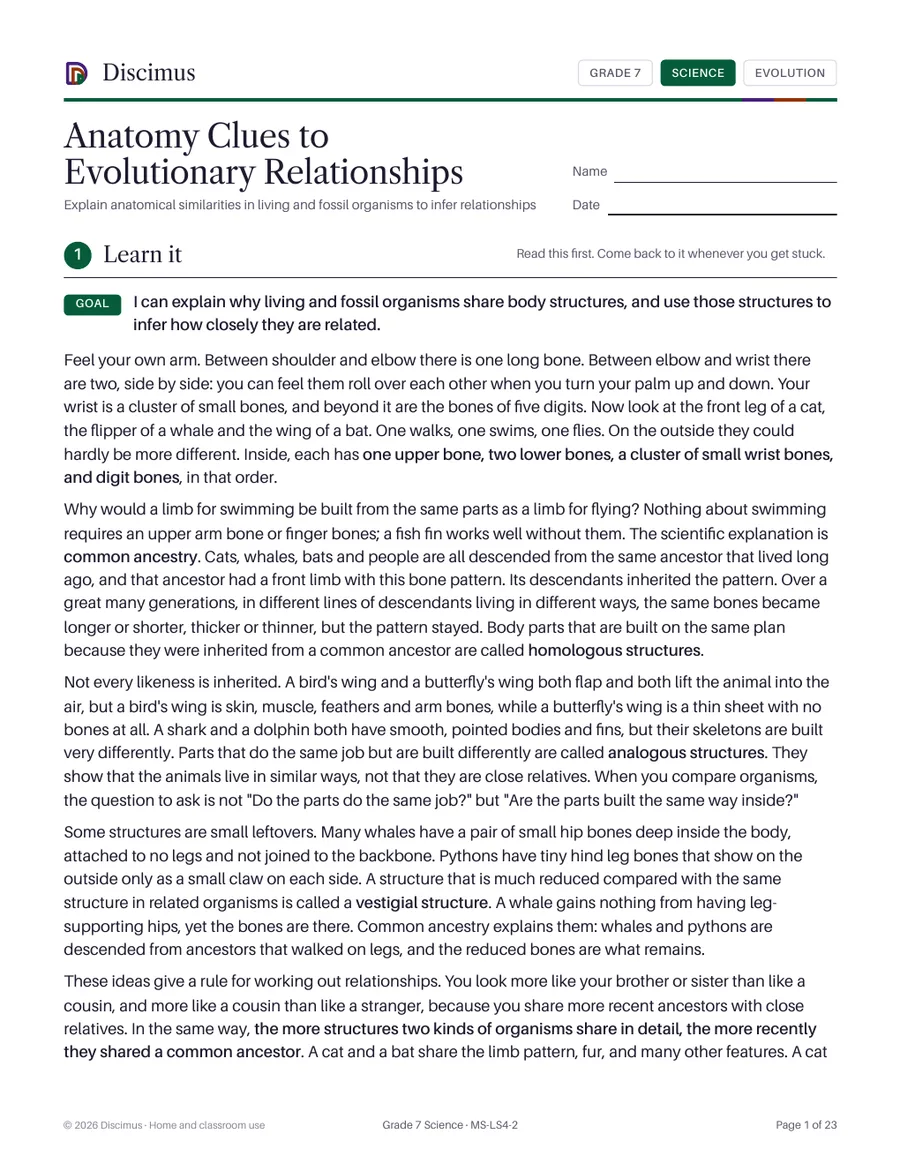
Anatomy Clues to Evolutionary Relationships
Explain anatomical similarities in living and fossil organisms to infer relationships
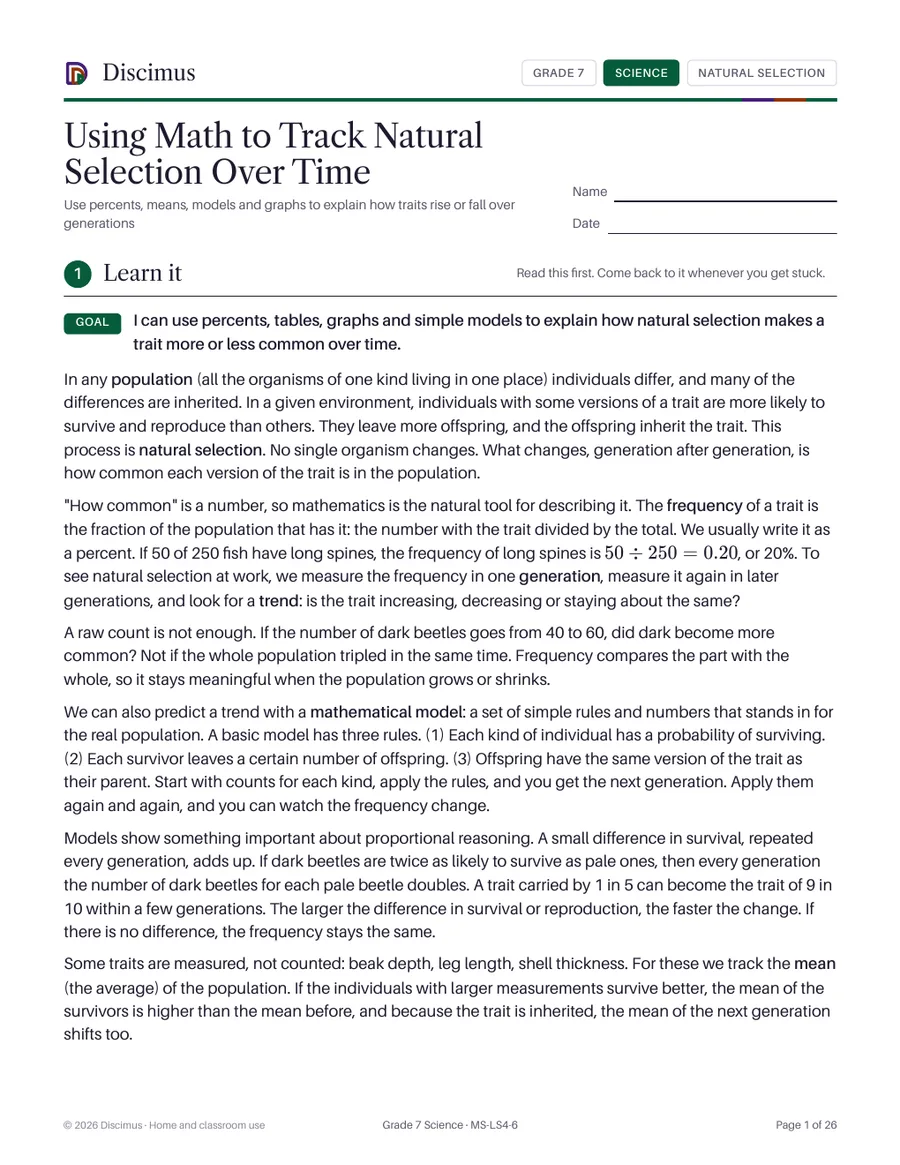
A full lesson on measuring natural selection with numbers. Students calculate trait frequencies and means, run generation-by-generation models, read and draw trend graphs, play a dice model of survival and study the Galápagos finch data.
For members. Join for $119.88 a year to download every Grade 7 worksheet.
Use mathematical representations such as proportions, probabilities, tables and graphs to support explanations of how natural selection makes particular traits more or less common in a population over time.
Explain anatomical similarities in living and fossil organisms to infer relationships
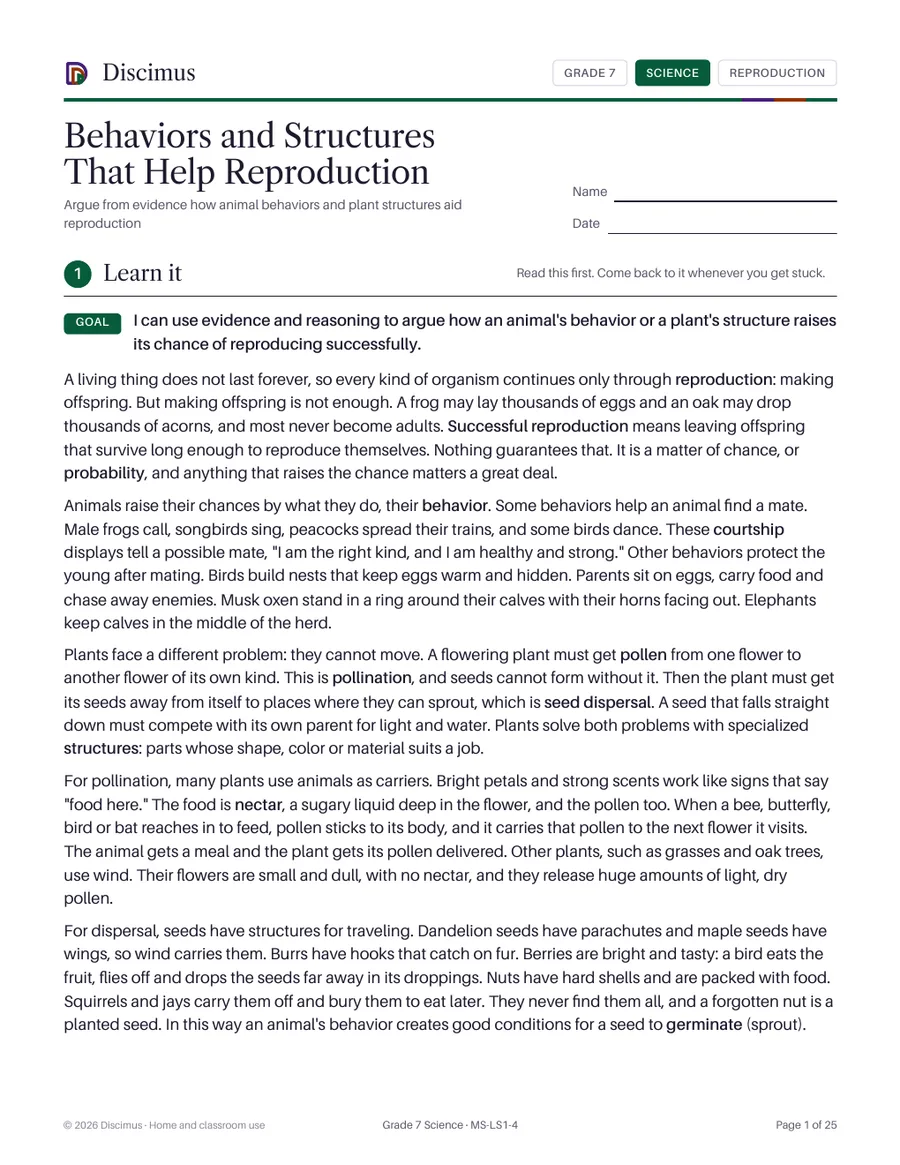
Argue from evidence how animal behaviors and plant structures aid reproduction
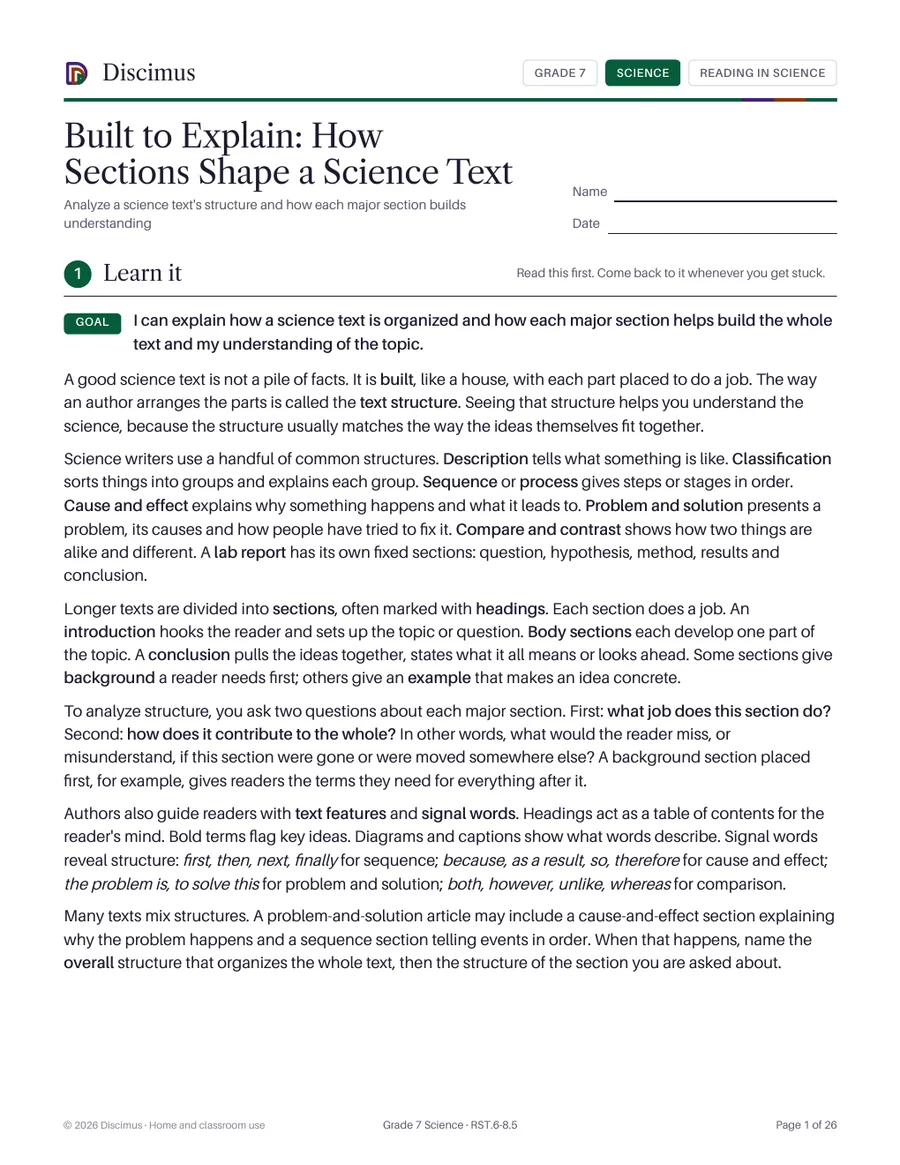
Analyze a science text's structure and how each major section builds understanding
Compare information from experiments, simulations and video with a text on the same topic