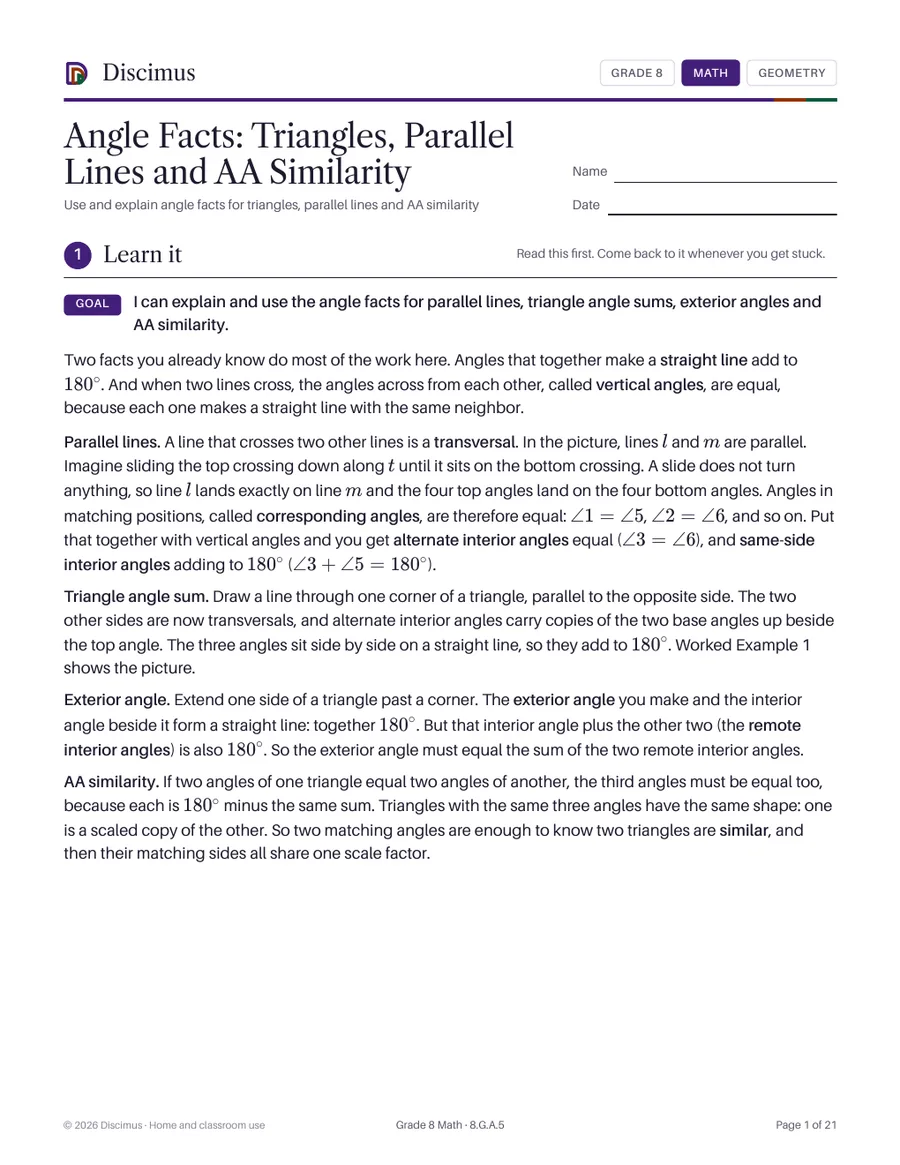
Angle Facts: Triangles, Parallel Lines and AA Similarity
Use and explain angle facts for triangles, parallel lines and AA similarity
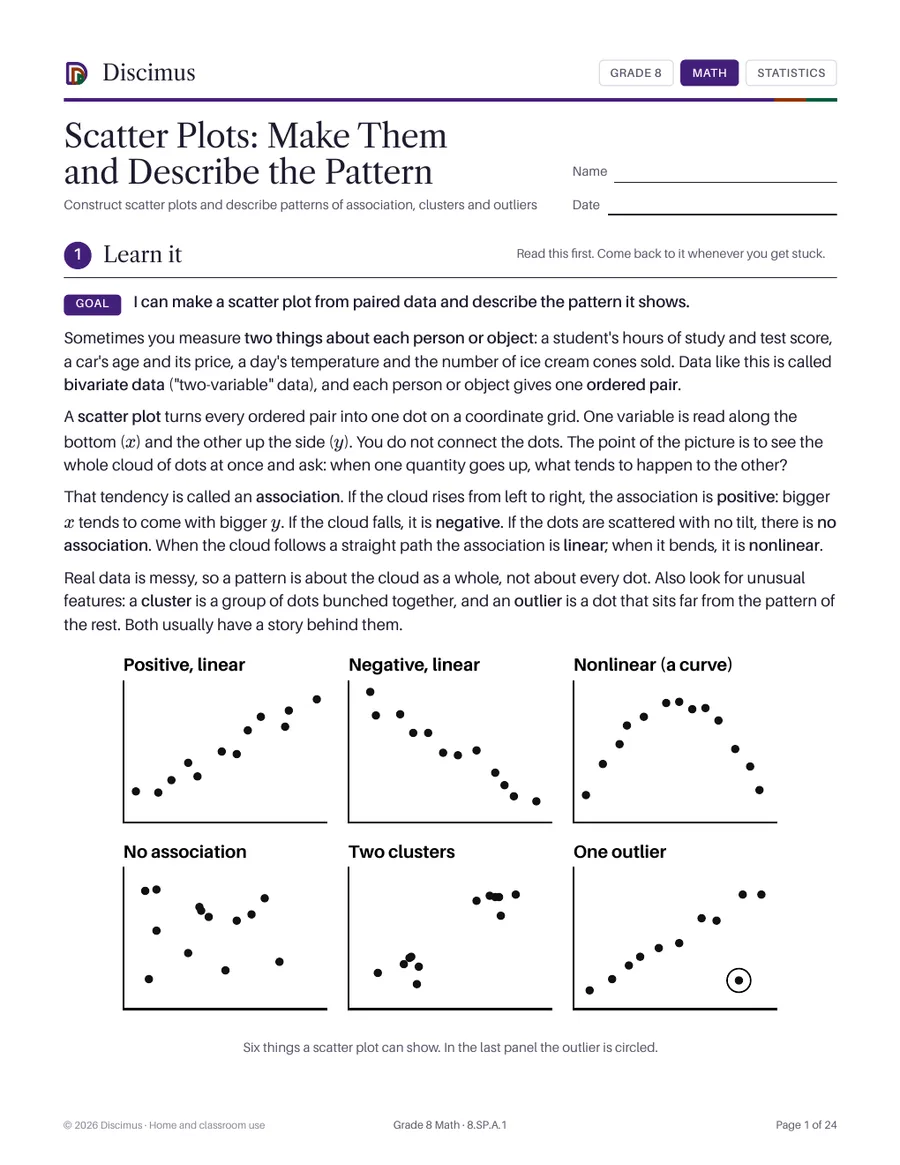
A full lesson on building scatter plots from paired data and describing what they show: positive, negative, linear and nonlinear association, clusters and outliers. 31 drill problems and 11 story problems, most with their own plot.
For members. Join for $119.88 a year to download every Grade 8 worksheet.
Make and read scatter plots of two-variable measurement data and describe patterns such as clusters, outliers, positive or negative association, and linear or nonlinear association.
Use and explain angle facts for triangles, parallel lines and AA similarity
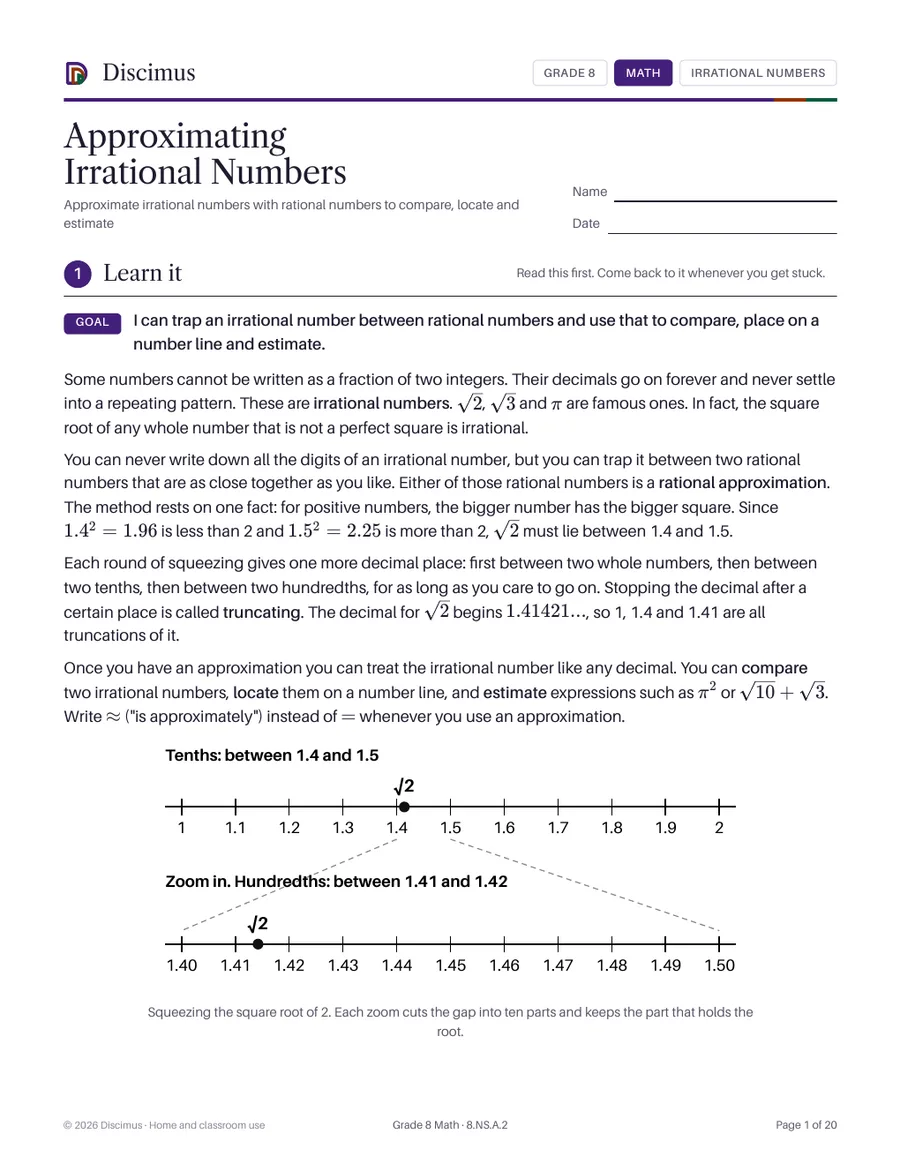
Approximate irrational numbers with rational numbers to compare, locate and estimate
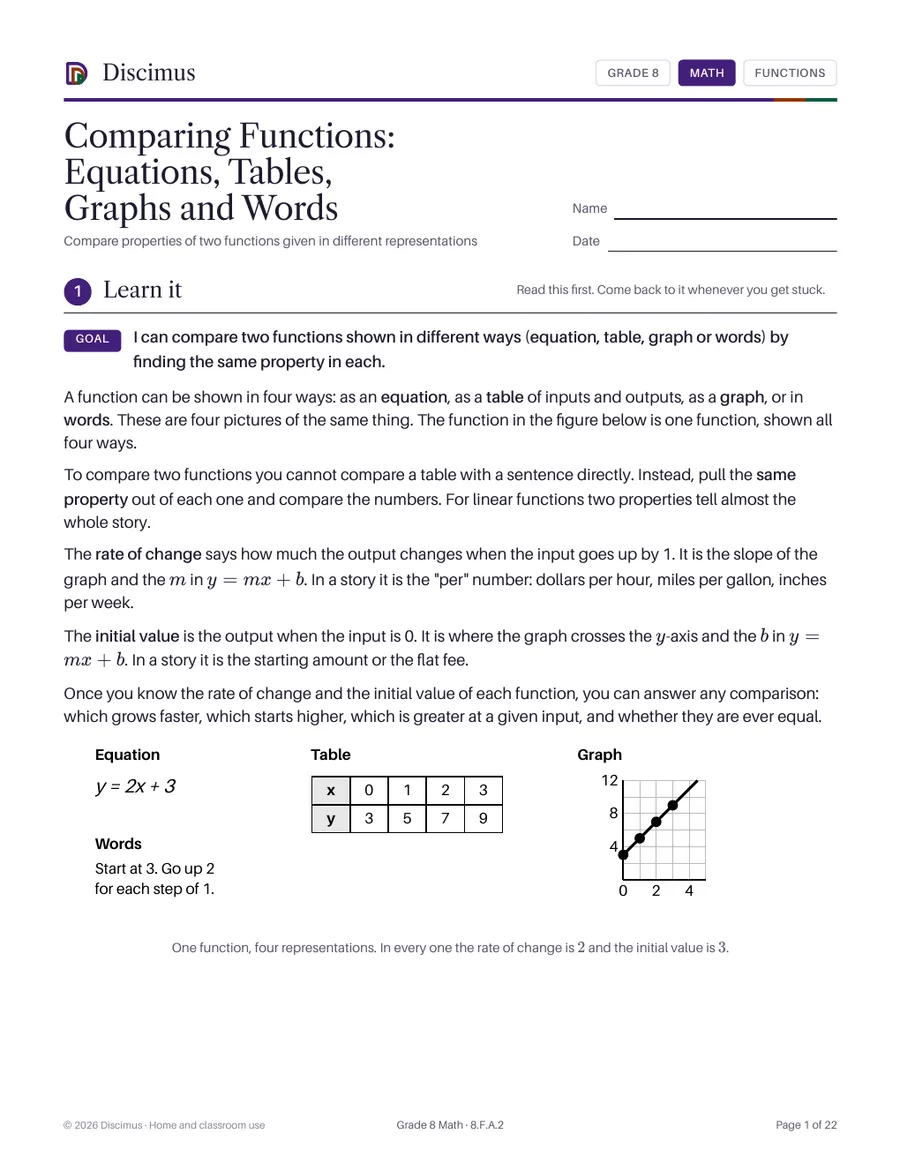
Compare properties of two functions given in different representations
Describe a sequence of rigid motions that shows two figures are congruent