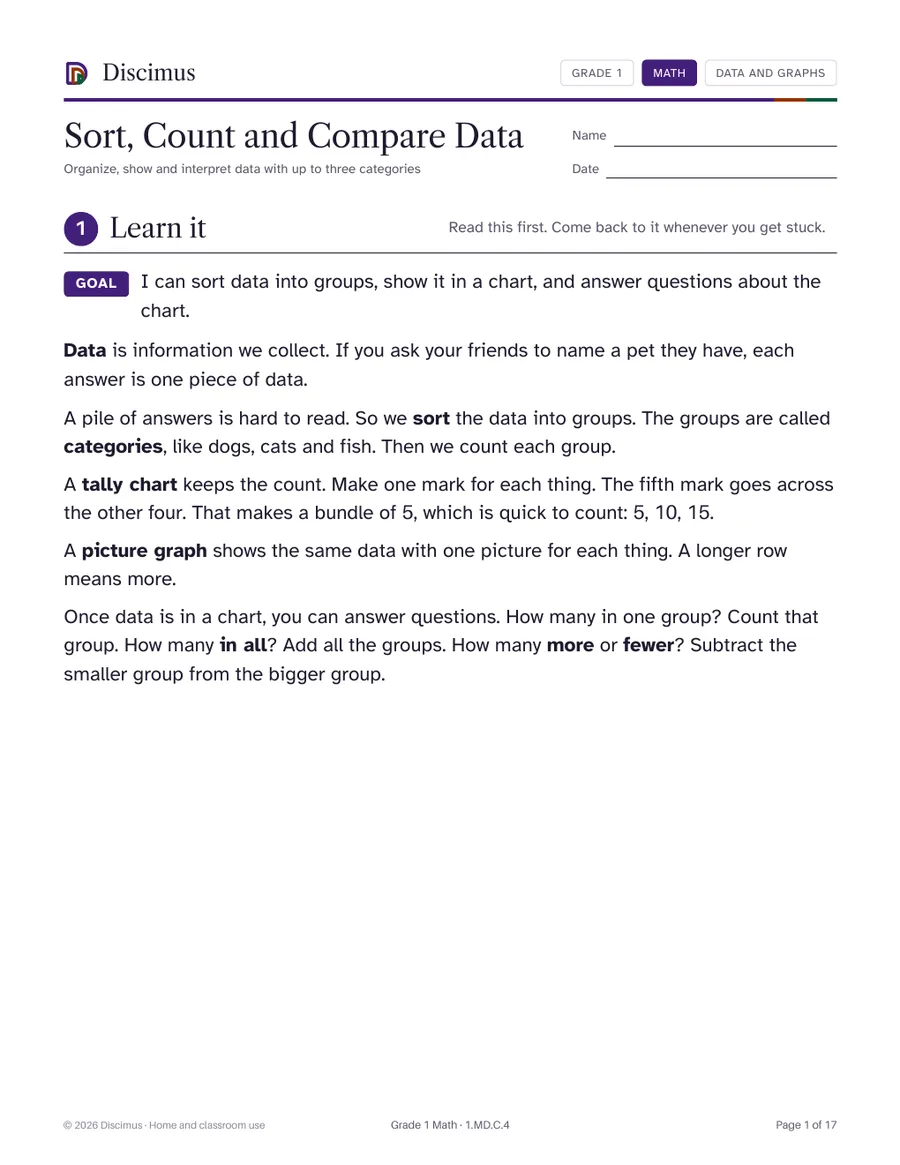
Sort, Count and Compare Data
Organize, show and interpret data with up to three categories
7 worksheets match.
Organize, show and interpret data with up to three categories
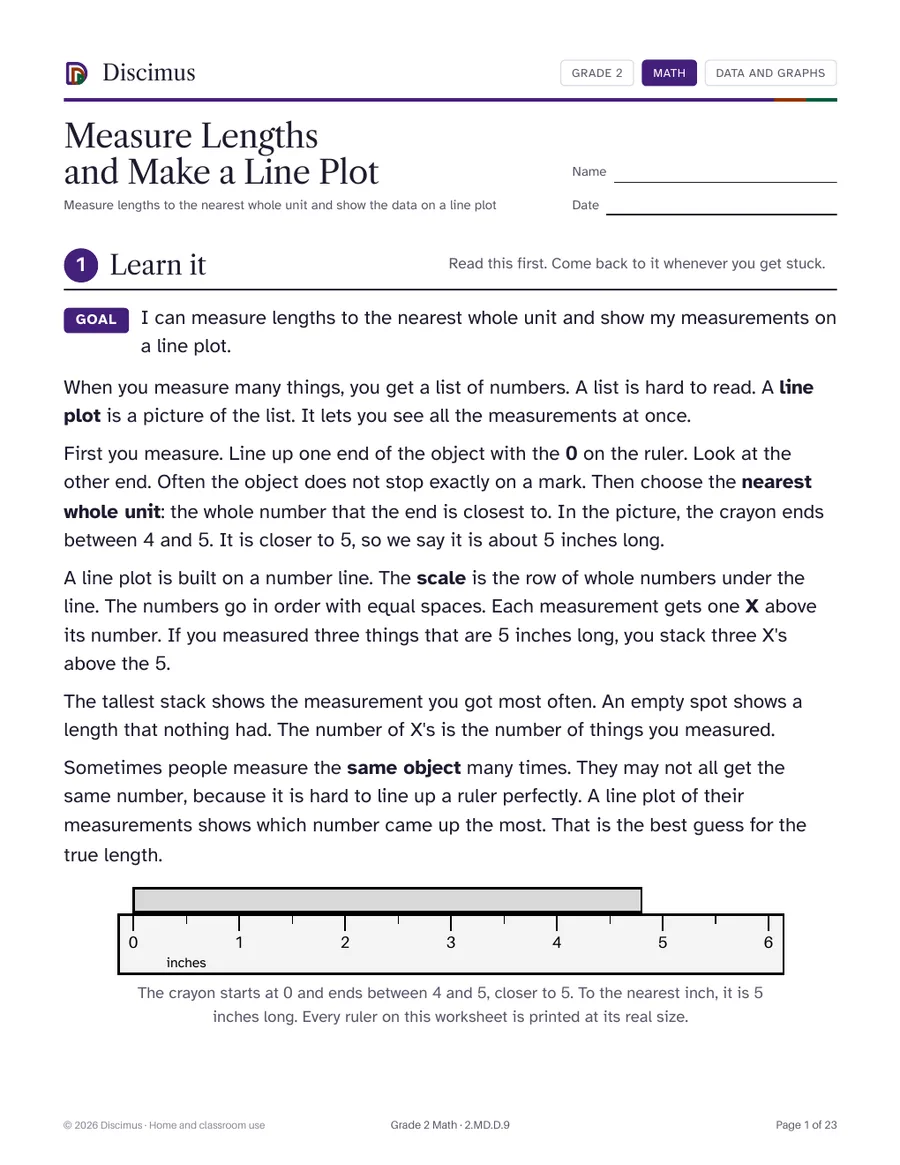
Measure lengths to the nearest whole unit and show the data on a line plot
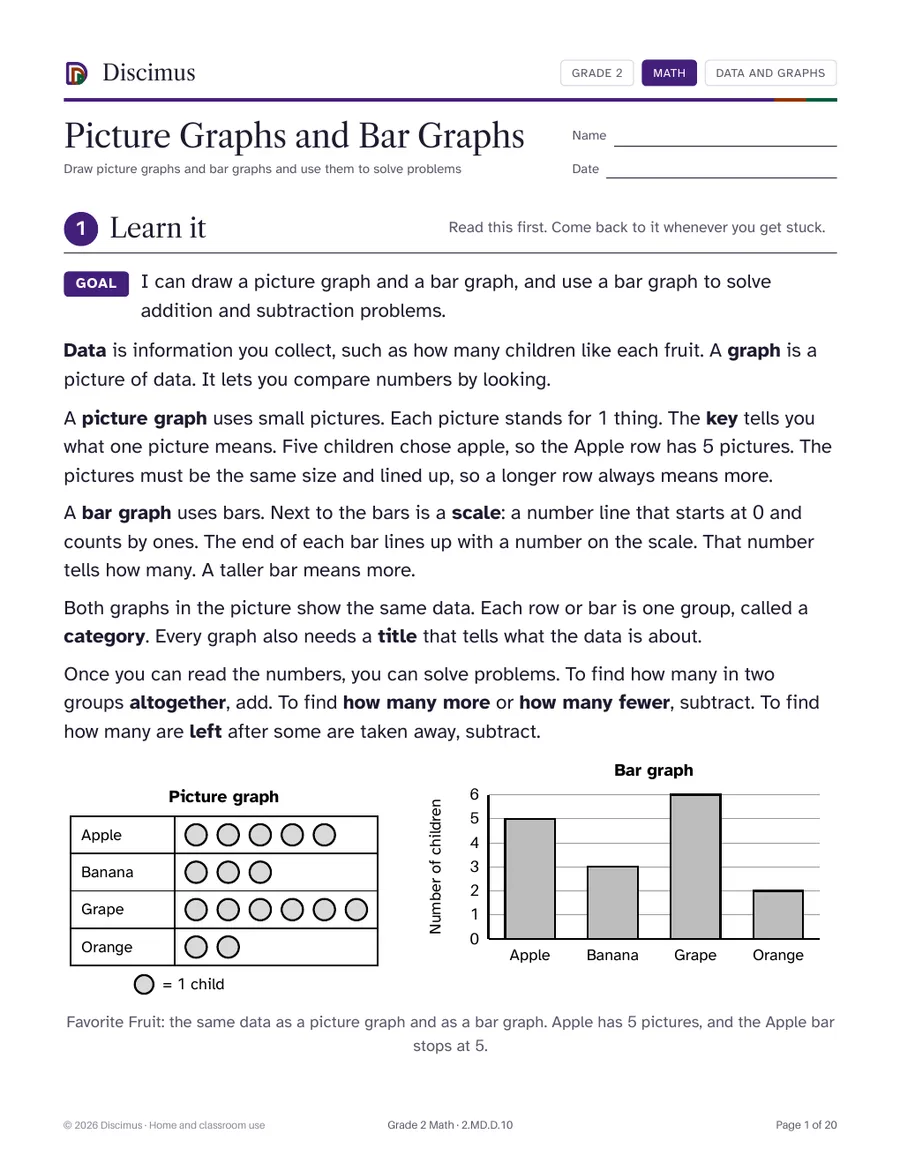
Draw picture graphs and bar graphs and use them to solve problems
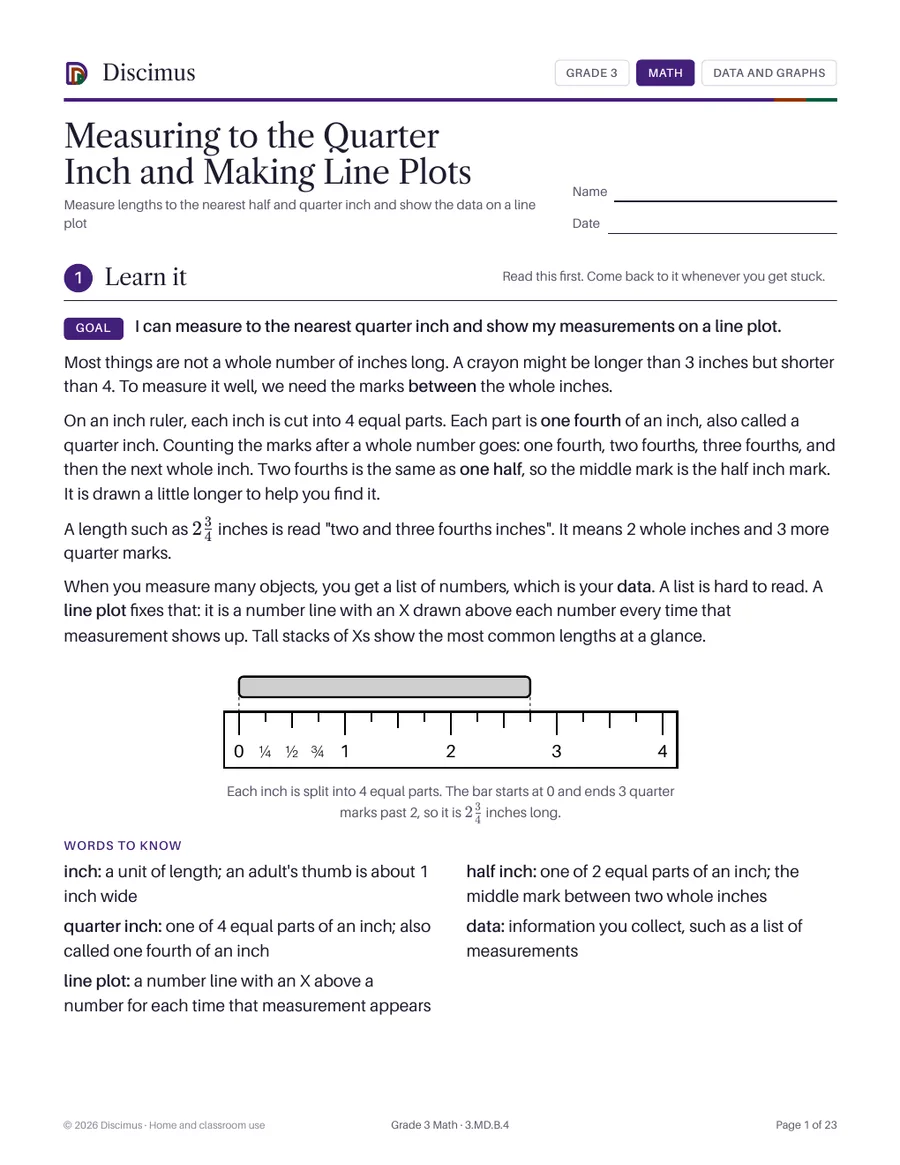
Measure lengths to the nearest half and quarter inch and show the data on a line plot
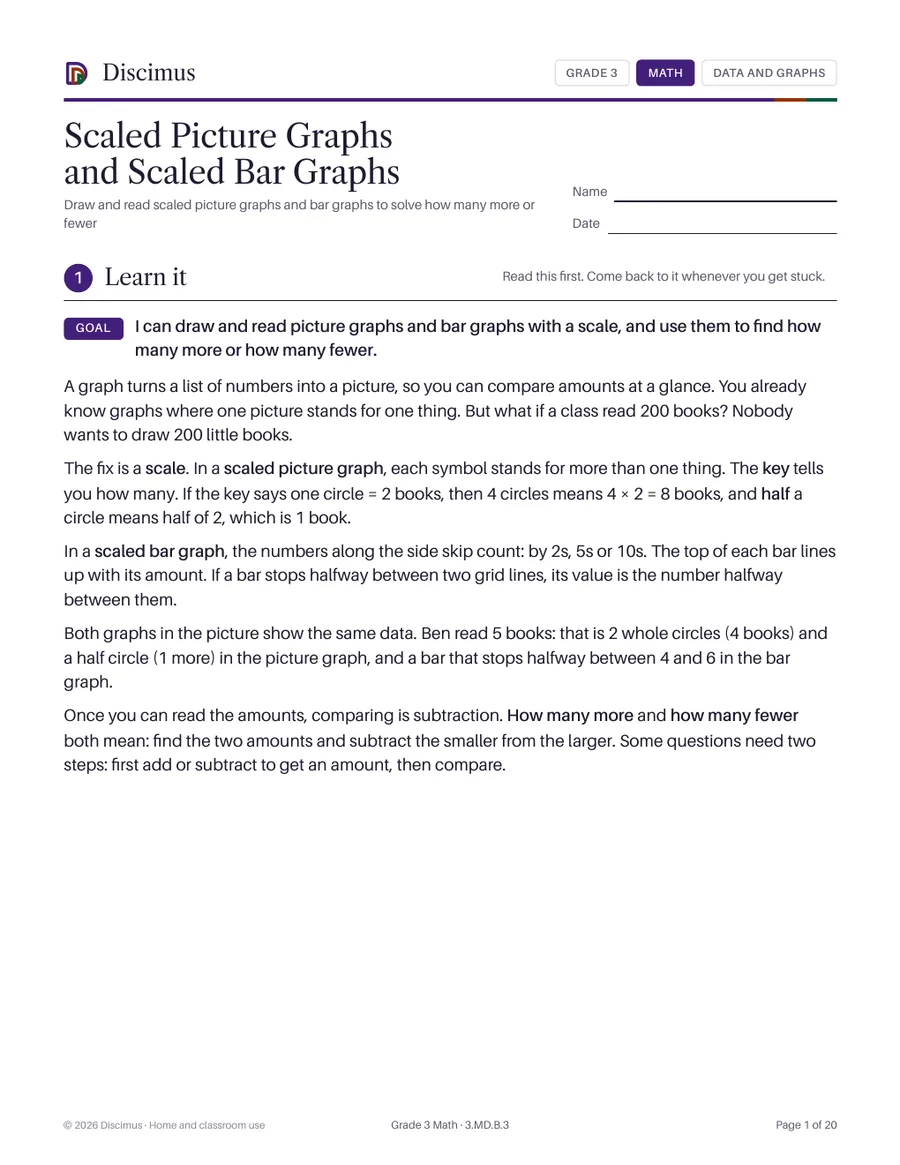
Draw and read scaled picture graphs and bar graphs to solve how many more or fewer
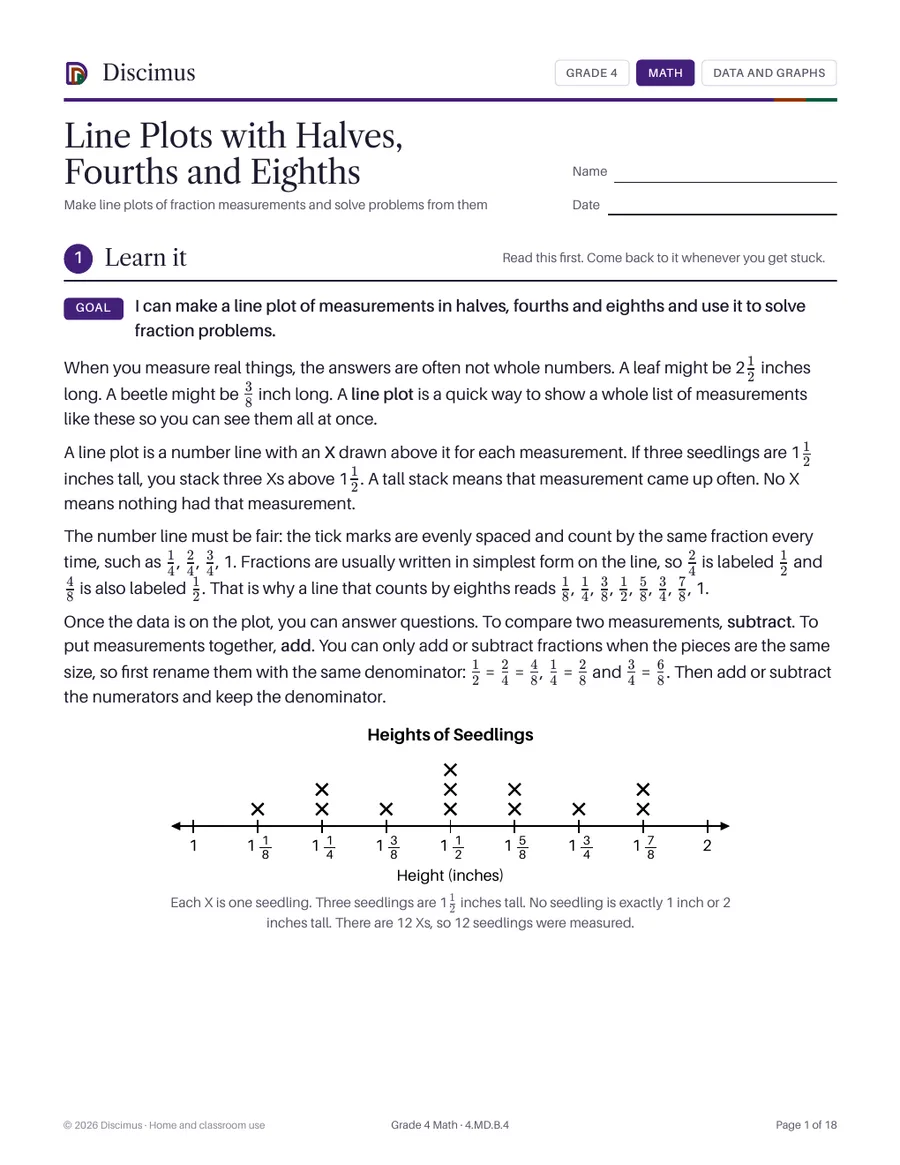
Make line plots of fraction measurements and solve problems from them
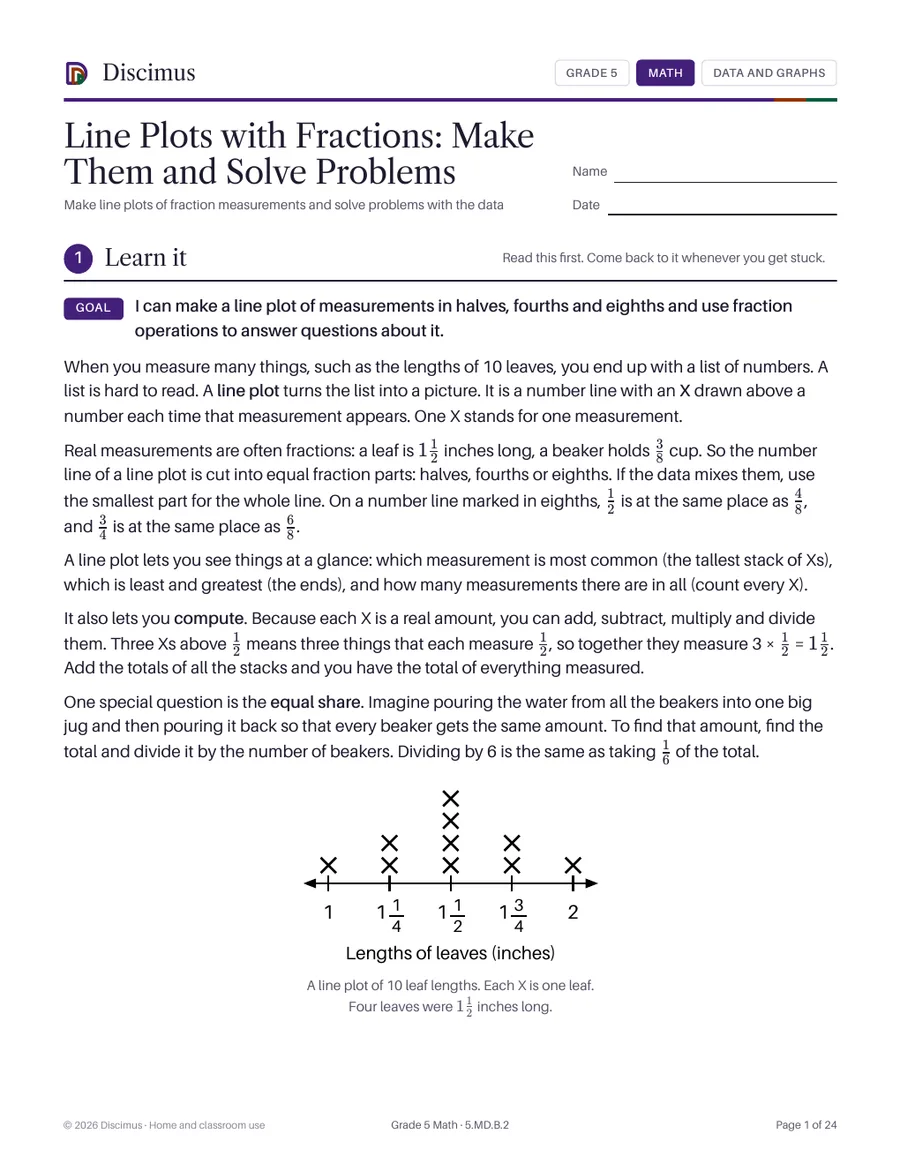
Make line plots of fraction measurements and solve problems with the data