Center and Variation: What Each Number Tells
Tell measures of center from measures of variation and explain what each describes
33 worksheets match.
Tell measures of center from measures of variation and explain what each describes
Choose measures of center and variability to fit the shape and context of the data
Describe a data distribution by its center, spread and overall shape
Describe the attribute a data set measures, how it was measured and its units
Display numerical data in dot plots, histograms and box plots
Report the number of observations in a data set from a list, table or plot
Recognize a statistical question as one that anticipates variability in the data
Find mean, median, IQR and MAD and describe a data set's pattern and striking deviations
Express the difference between two means as a multiple of the MAD to judge overlap
Compare two populations using measures of center and variability from random samples
Explain why a random, representative sample supports valid conclusions about a population
Use random samples to make inferences about a population and gauge how estimates vary
Informally fit a straight line to a scatter plot and assess how well it fits
Use a linear model to solve problems and interpret its slope and intercept in context
Construct scatter plots and describe patterns of association, clusters and outliers
Build and interpret two-way tables and use relative frequencies to describe association
Compare data sets using center and spread measures that fit the shape of the distribution
Distinguish between correlation and causation and evaluate causal claims
Fit a linear function to a scatter plot by eye and with technology, and write its equation
Fit linear, quadratic and exponential functions to data and use them to solve problems
Interpret differences in shape, center and spread in context, accounting for outliers
Interpret the slope and intercept of a linear model in the context of the data
Represent data with dot plots, histograms and box plots on the real number line
Assess the fit of a function by computing, plotting and analyzing residuals
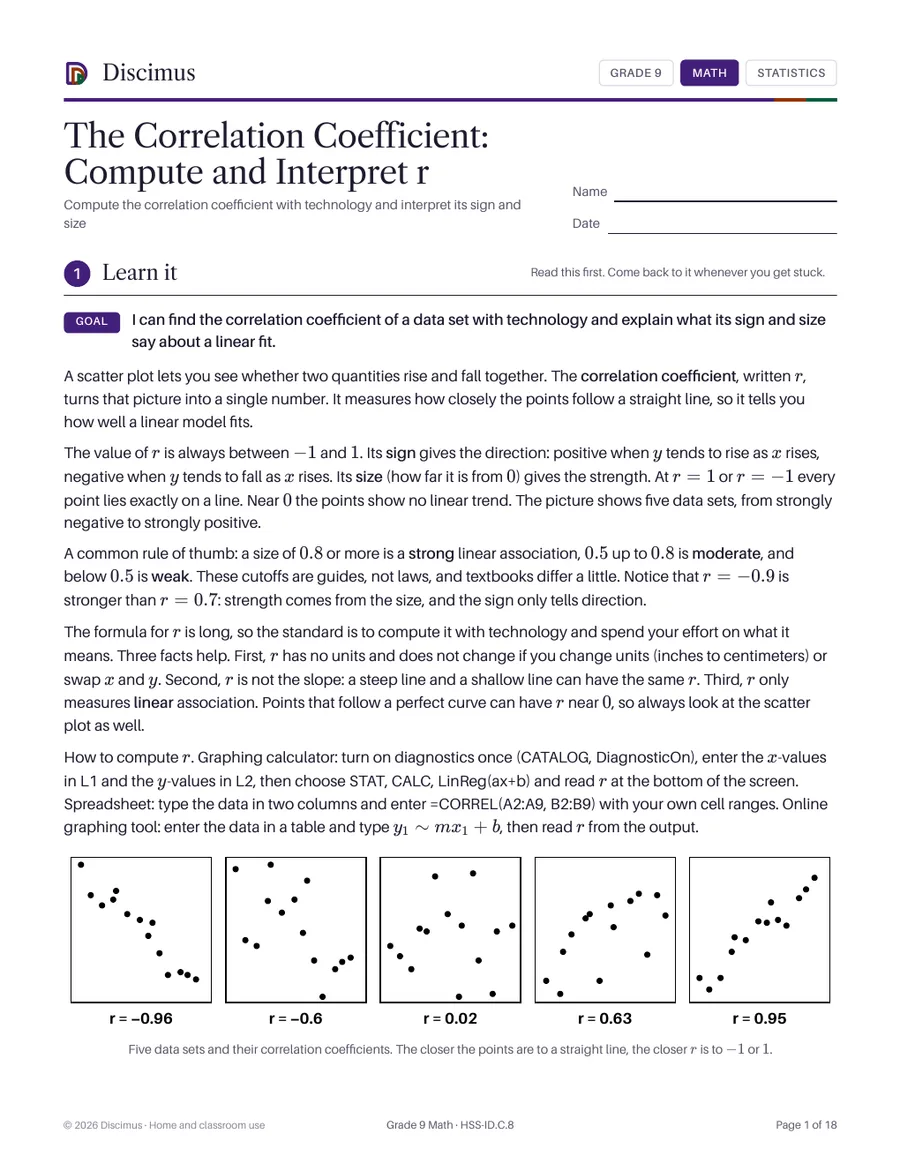
Compute the correlation coefficient with technology and interpret its sign and size
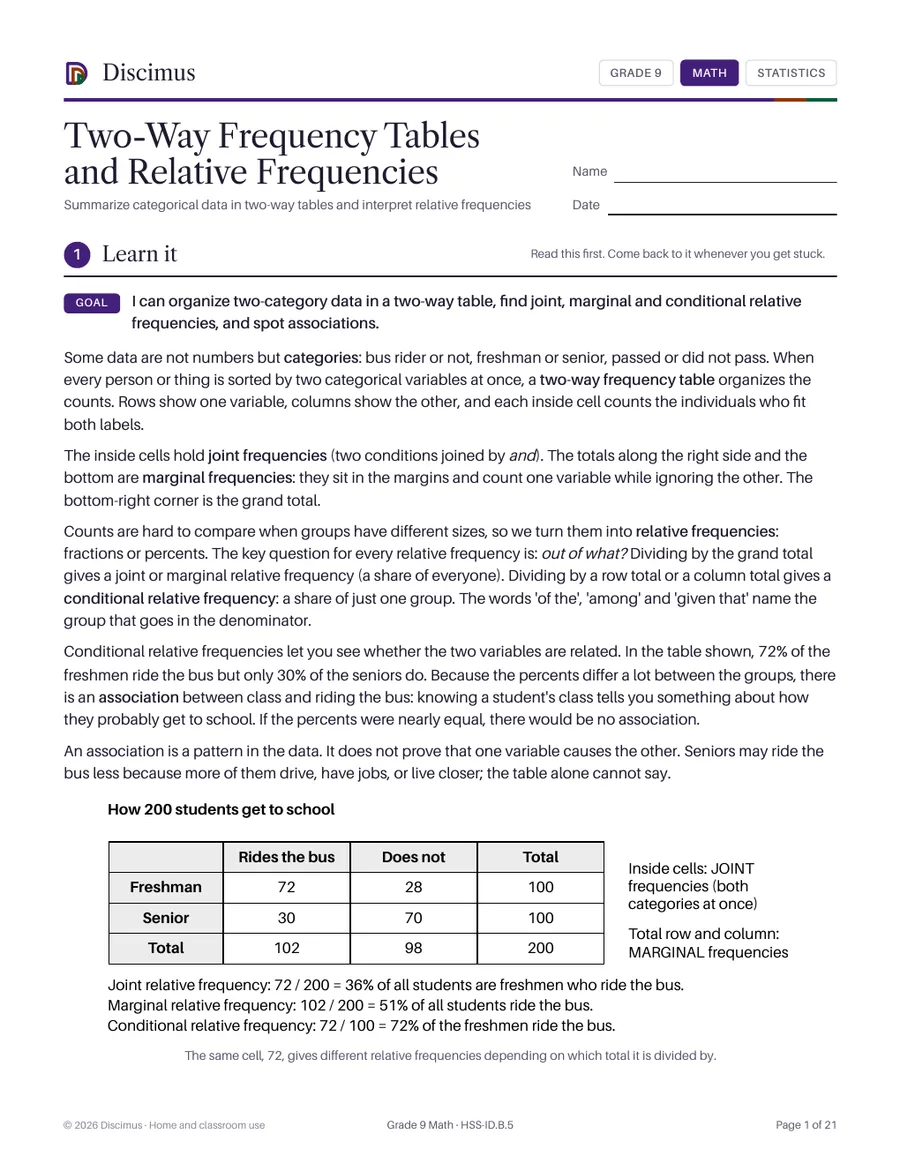
Summarize categorical data in two-way tables and interpret relative frequencies
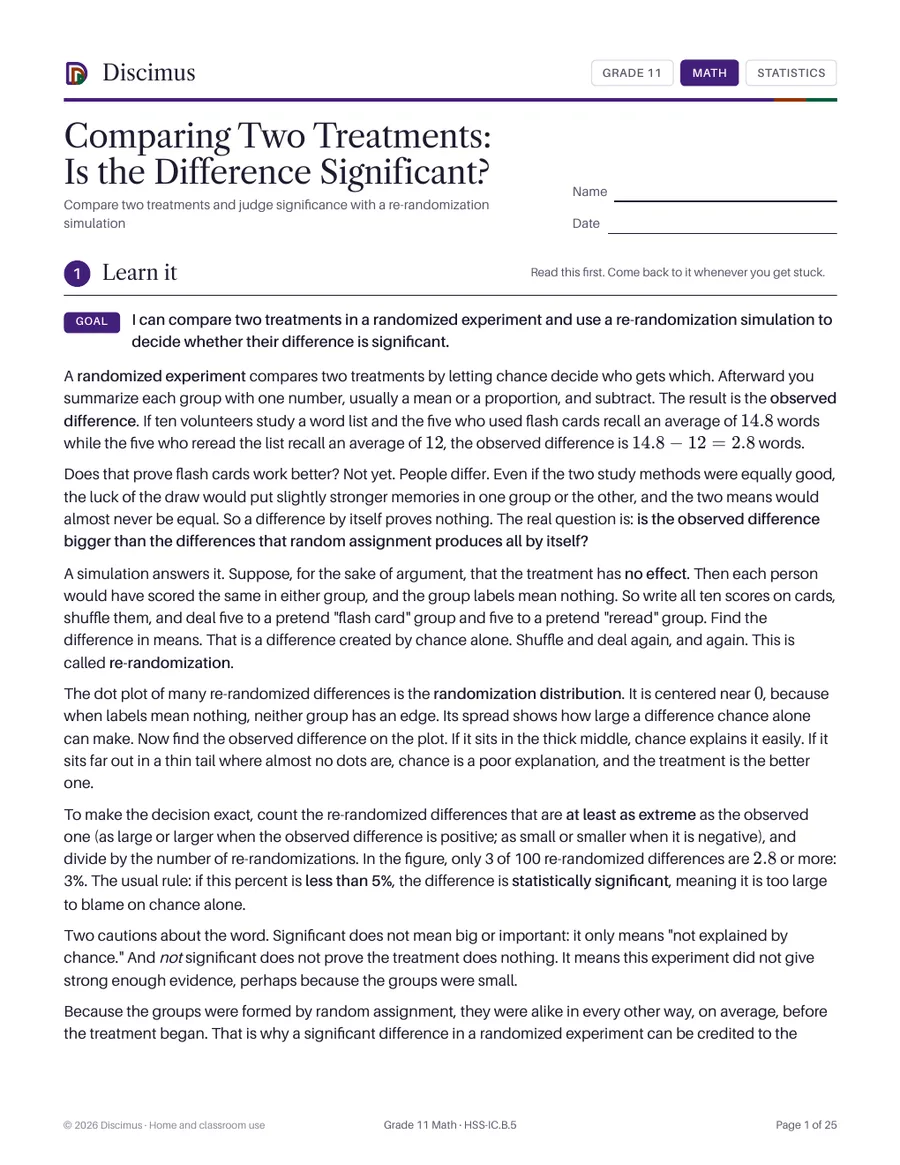
Compare two treatments and judge significance with a re-randomization simulation
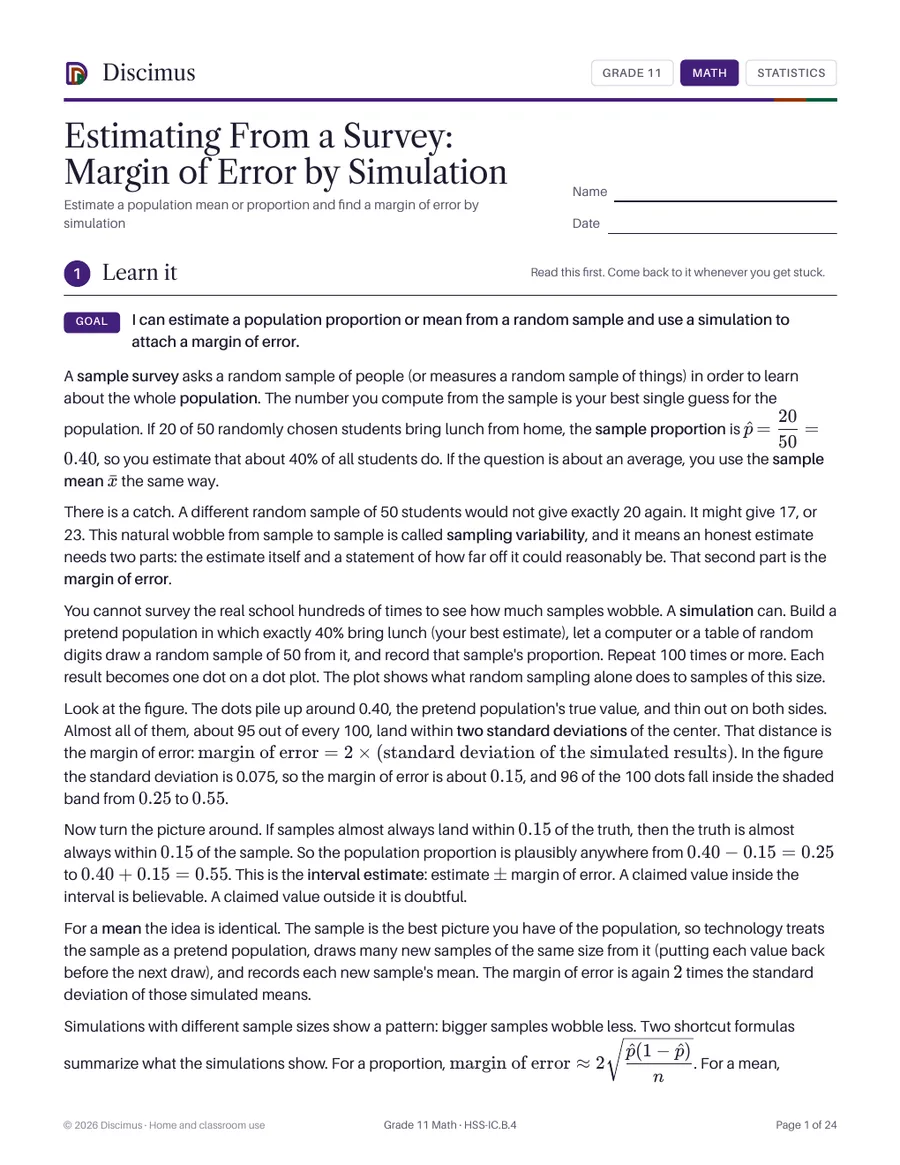
Estimate a population mean or proportion and find a margin of error by simulation
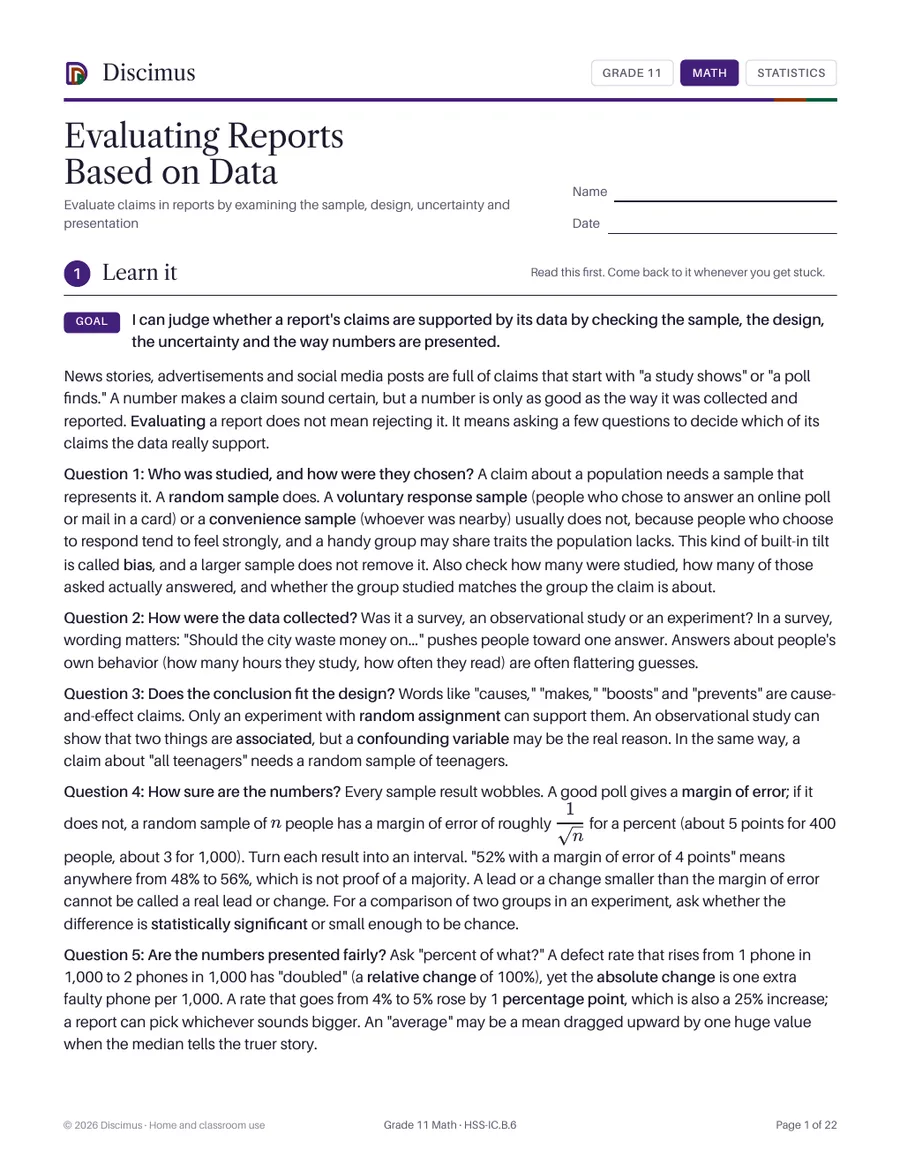
Evaluate claims in reports by examining the sample, design, uncertainty and presentation
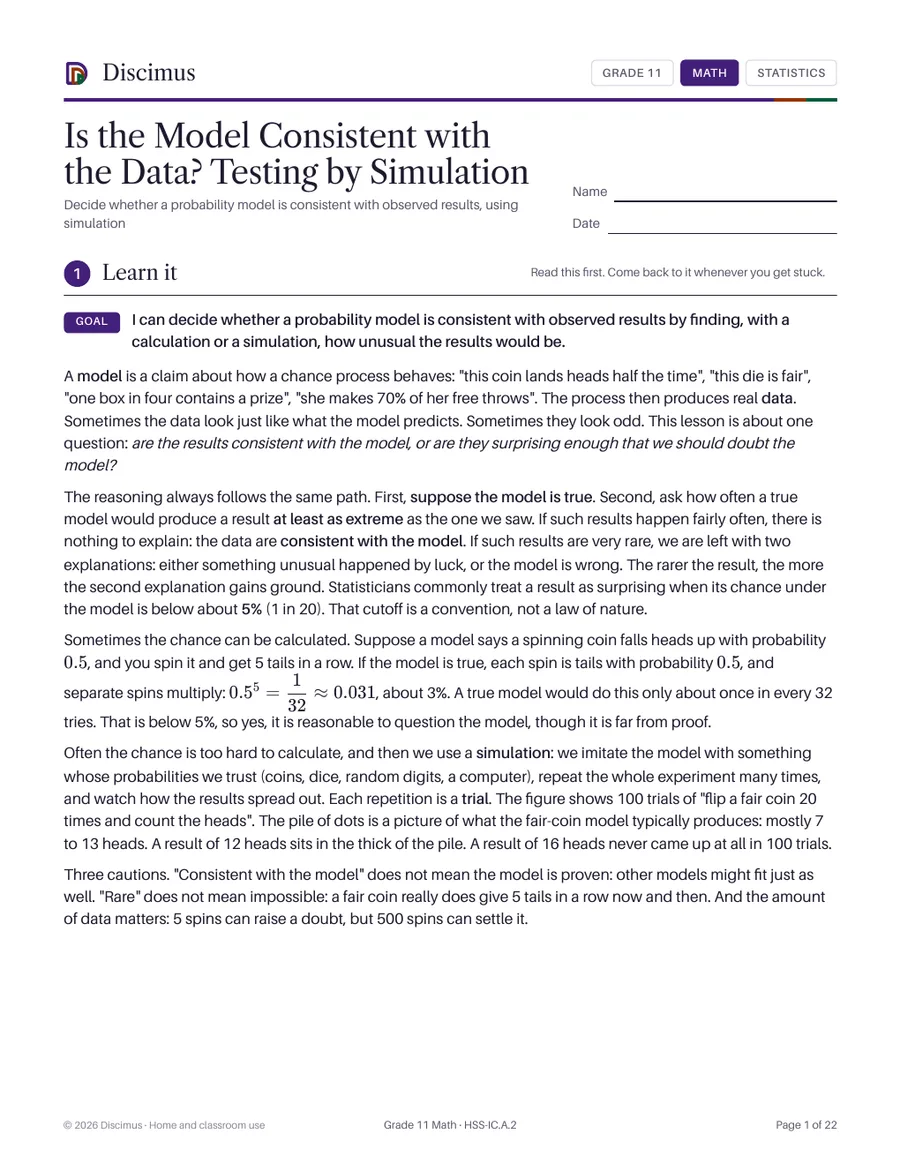
Decide whether a probability model is consistent with observed results, using simulation
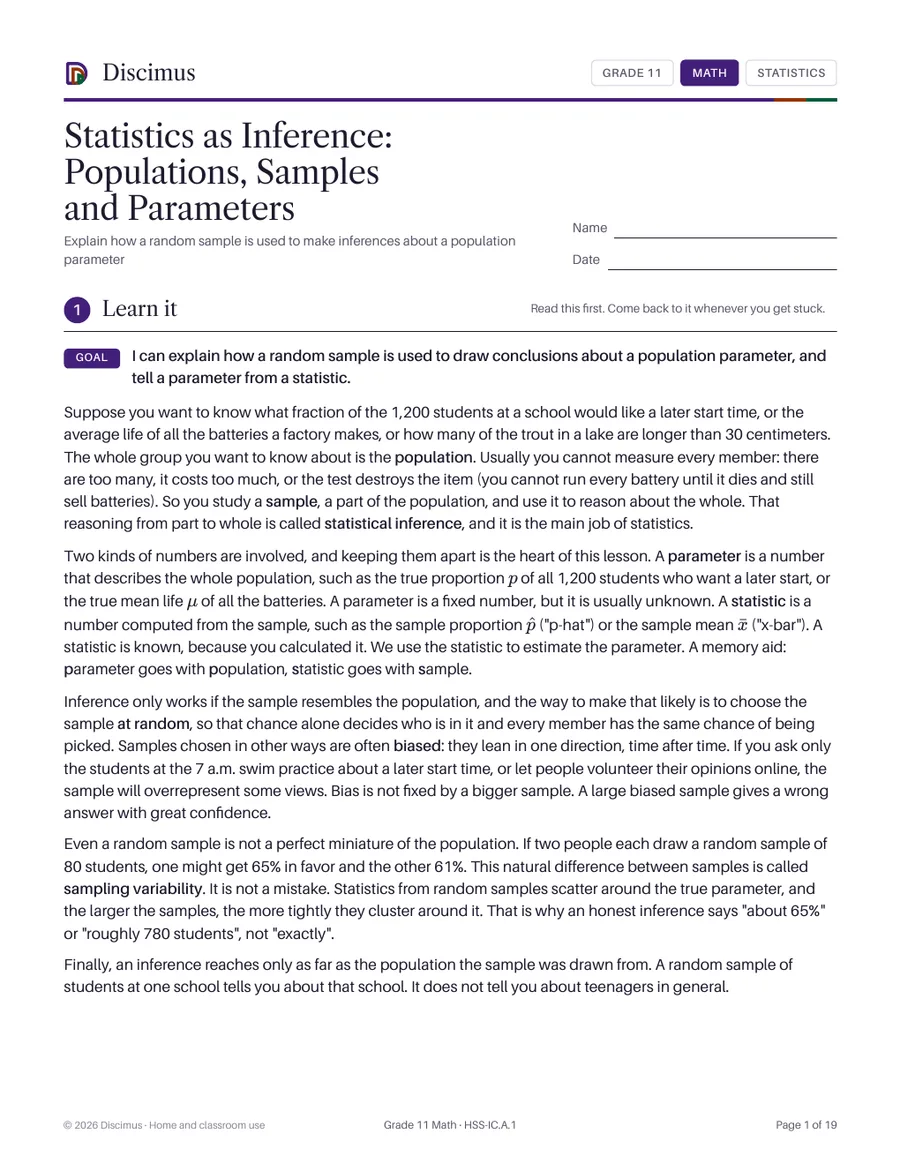
Explain how a random sample is used to make inferences about a population parameter
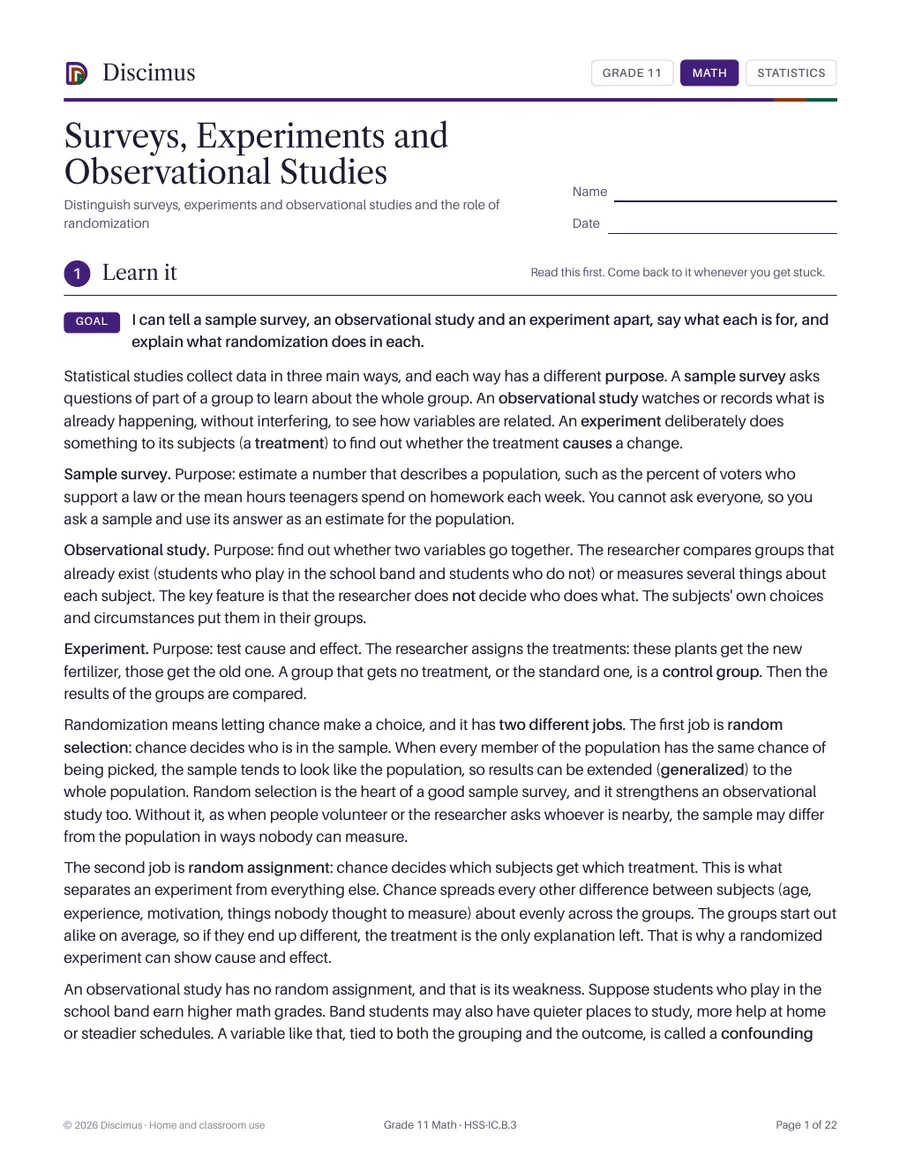
Distinguish surveys, experiments and observational studies and the role of randomization
Use z-scores, the empirical rule and a normal table to estimate population percentages